Get Quote ▼
Nano Spectrophotometer BSNA-206
- • High-quality flash Xenon lamp, longer service life.
- • High resolution CCD detector, fast measurement (5s), high repeatability and accuracy.
- • 7 inches LCD color touch screen, stand-alone system, no need for a PC.
- • User-friendly operating system, module UI design, simple and clear.
- • No need to dilute the sample, 1uL to 2uL is enough.
- • Multi-functions: Nucleic acid , Protein, Kinetics, Spectrum scanning, End-point and OD600 measurement.
- • Available to upgrade software by USB, low maintenance cost.
- • Storage by USB, simple to retrieve test data.
 Get Quote
Specifications
| Model | BSNA-206 |
| Generation Specification | |
| - Light Source | Xenon Lamp |
| - Detector | CCD (2048 Pixels) |
| - Wavelength Range | 190-1100 nm |
| - Wavelength Accuracy | ±1 nm |
| - Spectral Resolution | 0.3 nm |
| - Dimension | 230x290x220 mm |
| - Weight | 3 kg |
| - Operating Voltage | 12 V DC |
| - Power Consumption | 18 W |
| Nano Volume Specification | |
| - Absorbance Precision | 1%@100 ng/μL |
| - Absorbance Range | 0-200 Abs (10 nm equivalent) |
| - Detection Limit | 2 ng/μL (dsDNA) |
| - Max. Concentration | 15000 ng/μL (dsDNA) |
| - Measurement Time | 5 s |
| - Min. Sample Volume | 1 μL |
| - Path Length | 0.01-1.2 mm (auto-ranging) |
| Cuvette Specification | |
| - Beam Height | 8.5mm |
| - Absorbance Range | 0.002-2.0Abs |
| - Measurement Time | 3s |
| - Path Length | 10mm |
Features
• High resolution CCD detector, fast measurement (5s), high repeatability and accuracy.
• 7 inches LCD color touch screen, stand-alone system, no need for a PC.
• User-friendly operating system, module UI design, simple and clear.
• No need to dilute the sample, 1uL to 2uL is enough.
• Multi-functions: Nucleic acid , Protein, Kinetics, Spectrum scanning, End-point and OD600 measurement.
• Available to upgrade software by USB, low maintenance cost.
• Storage by USB, simple to retrieve test data.
• Two USB ports for data transmission and outer tools like mouse and keyboard.
• Smart and compact design, light and easy to move.
Photos
Operating Manuals
 Download Manual (PDF)
1. Introduction
1.1 Measurement Principle
1.2 Performance and Features
1.3 Applications
1.4 Packing List
1.5 Product Design
1.6 Technical Specifications
1.7 Maintenance
2. Basic Use
2.1 Pedestal
2.2 Cuvette
2.3 Blank Calibration
2.4 Keyboard
3. User Interface
3.1 Login
3.2 Main interface
3.3 Submenu
3.4 Nucleic Acids Measurement
3.5 Protein Measurement
3.6 End Point and OD600 Measurement
3.7 Kinetic Measurement
3.8 Spectrum Measurement
3.9 Search
3.10 Account Setting
3.11 Power Panel
3.12 Setup
1. Introduction
1.1 Measurement Principle
The measurement principle of bio-photometer is based on the Lambert-Beer law. When the beam of collimated monochromatic light passes through a certain uniform colored solution, the absorbance of the solution is directly proportional to the concentration of the solution and the optical path. And it supplies basis for the quantitative analysis. The Lambert-Beer law is described as following formula:
A=kxbxC
A - Absorbance of the analyte.
k - The absorption coefficient.
b - The path length in cm.
c - The analyte concentration.
1.2 Performance and Features
The performance and features of BSNA-206 Bio-photometer are as following:
• Imported long service life UV-Visible light source (Xenon Flash Lamp), without pre-warming.
• 7 inches LCD touch screen, enables the measurement, data storage and transmission without computer.
• Friendly operation system and graphic operation interface, enables easy operation.
• High resolution CCD detector, enables fast detection in five seconds, with good repeatability and high accuracy.
• Micro volume detection with less sample consumption as low as 1L, enables high concentration sample measurement without dilution.
• Powerful measurement functions such as nucleic acids measurement, protein measurement, kinetic measurement, spectrum measurement, end point measurement and OD600 measurement are available.
• Two USB ports, enables data transmission by USB Flash Drive, instrument operation with mouse and keyboard.
• The measurement results and graphs are clearly displayed, and the graph can be screen captured. The data can be backed up and saved to USB Flash Drive, and the storage path is easy for search.
• Convenient data search, and history data can be reviewed according to title, time, or measurement item, enables data easily exported and backed up.
• High performance without maintenance, and system upgrade is available with USB Flash Drive.
CUVETTE & MICROVOLUME MEASUREMENT
Samples in universal cuvette or microvolume can be measured.

EASY UPGRADES
The system can be upgraded with ease via USB Flash Drive.
MINIMUM MAINTENANCE
No recalibration or internal maintenance is needed.
1.3 Applications
BSNA-206 Bio-photometer is designed for both cuvette and microvolume samples. The valid wavelength range is 190nm-1100nm. It's applied to fast detection of samples such as DNA, RNA and proteins. Universal sample measurement with cuvette is also available. With high accuracy and superb repeatability, it has special advantages in the fields of biochemistry analysis, teaching and scientific research.
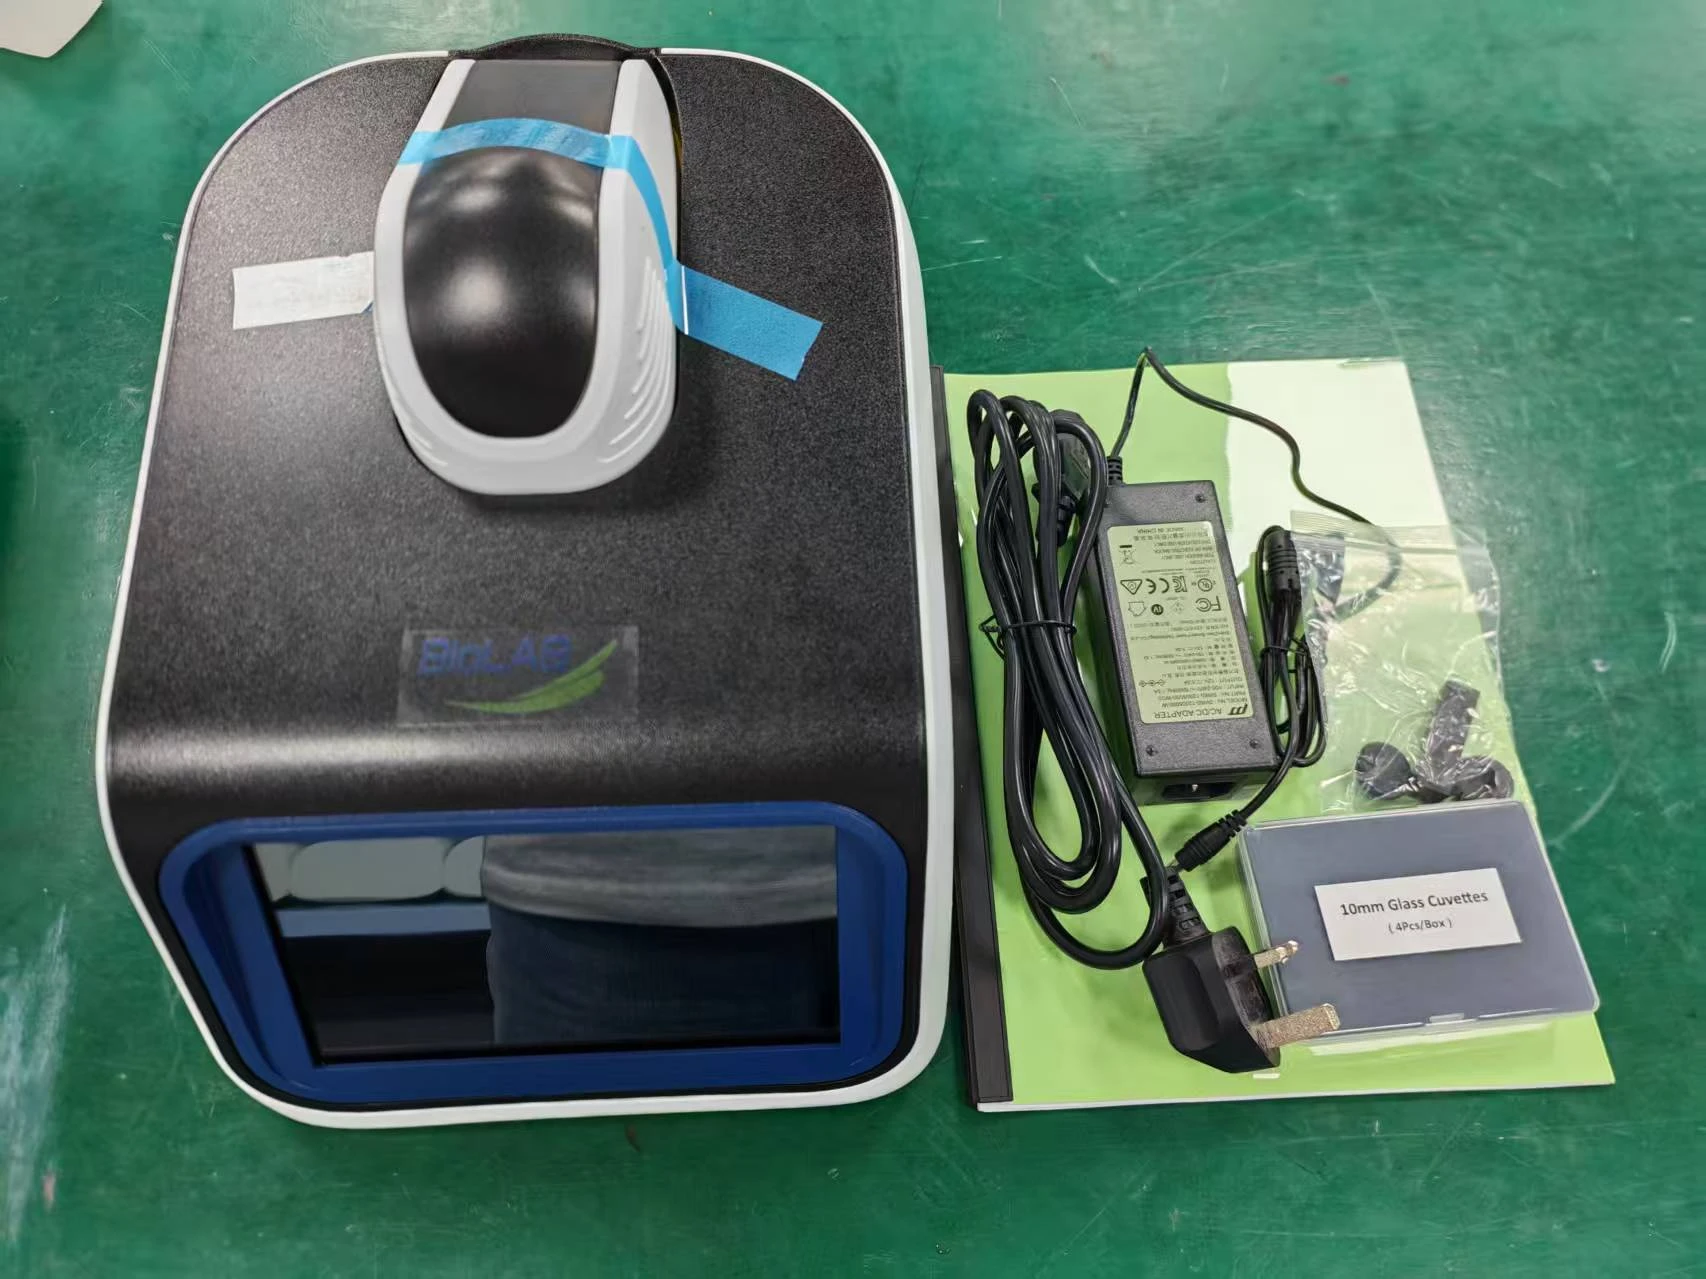
1.4 Packing List
NO. | ITEM | UNIT | QTY. | NOTE |
1 | BSNA-206 Bio-photometer | set | 1 | |
2 | Pedestal Cover | pc | 1 | Fig. 1-1 |
3 | Blocking Stick | pc | 1 | Fig. 1-1 |
4 | Cuvette | pc | 1 | Fig. 1-1 |
5 | Power Cord | pc | 1 | |
6 | Power Adaptor | pc | 1 | |
7 | User's Manual | pc | 1 |
Table 1

Figure 1
1.5 Product Design
The main structure of BSNA-206 Bio-photometer is shown in Figure

Figure 2
The right side and back side of BSNA-206 Bio-photometer are respectively shown in Fig. 3 and Fig. 4:

Figure 3

Figure 4
1.6 Technical Specifications
General Specification
Light Source | Xenon Flash Lamp |
Detector | CCD (2048 Pixels) |
Wavelength Accuracy | ±1 nm |
Wavelength Range | 190 nm - 1100 nm |
Spectral Resolution | 0.3 nm |
Dimensions | 230 mm x 290 mm x 220 mm (W x D x H) |
Weight | 3 kg |
Operator Voltage | 12 V DC |
Power Consumption | 18 W |
Warranty | 1 Year |
LCD Touch Panel | 7.0 inch |
Table 2
Micro Volume Specification
Absorbance Precision | 1% (@100 ng/L) |
Absorbance Range | 0 -300 Abs. (equivalent to 10 mm path length) |
Detection Limit | 2 ng/L (dsDNA) |
Maximum Concentration | 15000 ng/L (dsDNA) |
Measurement Time | 5 s |
Minimum Sample Size | 1 L |
Path Length | 0.01 - 1.2 mm (Auto-ranging) |
Table 3
Cuvette Specification
Beam Height | 8.5 mm |
Absorbance Range | 0.002 - 2.0 Abs. |
Measurement Time | 3 s |
Table 4
1.7 Maintenance
• Due to fixed modules and immovable parts, internal maintenance is not needed.
• Clean the exterior with a clean and dry wipe when there is a spill or contamination.
• DO NOT try to disassemble the instrument in any situation.
• Use an electric supply that conforms to industry standards.
• Place the instrument in a clean environment and away from other devices that vibrate (e.g. centrifuges).
• Test the general functions of the device - check buttons and the power switch.
• Confirm that the mechanical components are in good condition.
• Make sure accessories, cables, and positions are clean and intact.
• Calibration and update from the manufacturer is possible.
• It is recommended that user keep the instrument plugged in even when not in use.
2. Basic Use
The basic operation process of BSNA-206 Bio-photometer is described in Figure

Figure 5
Sample insertion of the two detection modes (Cuvette Mode and Micro Volume Mode) is shown in Fig.6

Figure 6
2.1 Pedestal
Micro volume sample measurement includes the use of the Pedestal. The Pedestal has upper and lower pedestals. Targeted micro volume sample should be gently pipetted on the center top of the lower pedestal, and the Blocking Stick should be inserted during the micro volume measurement. The sample should be wiped off from both lower and upper pedestals with a dry and lint-free laboratory wipe after the measurement.
Procedure for Pedestal Cleaning
The brief process diagram is shown in Fig.7

Figure 7
1. Open the upper cover of the instrument.
2. For standard cleaning, pipette 5 μl distilled water onto the lower pedestal.
• Use 0.5M HCl instead of distilled water to clean dried proteins from the pedestal.
• For decontamination, use a solution of 0.5% sodium hypochlorite (1:10 dilution) or other sanitizing solution instead. Then, repeat the process with distilled water.
3. Close the upper cover of the instrument and wait 3 minutes.
4. Open the upper cover of the instrument and wipe both the upper and lower pedestals with a dry and lint-free laboratory wipe.
Note: Do not use isopropyl alcohol or detergents for pedestal cleaning.
Procedure for Pedestal Reconditioning
1. Open the upper cover of the instrument.
2. Apply a tiny amount of the pedestal reconditioning compound to the surfaces of the upper and lower pedestals. Apply the compound in a very thin layer, making sure that it stays as even as possible.
3. Wait at least 30 seconds for the compound to dry completely.
4. Wipe away the compound with a clean, dry laboratory wipe. Make sure to wipe away the compound completely by rubbing the pedestal surfaces very thoroughly.
2.2 Cuvette
Cuvette measurement includes the use of cuvette. The target sample should be prepared in a universal cuvette, and the cuvette should be gently inserted in the cuvette port for the measurement. The lower pedestal should be covered by the Pedestal Cover during the cuvette measurement. The direction of the light pathway during the measurement is indicated on the upper side of the port. The minimum volume of the sample is 1 ml.

Figure 8
Note: Make sure the V shape side is facing the same direction as the arrow on top.
Procedure for Cuvette Cleaning
1. Open the upper cover of the instrument.
2. Use a dry and lint-free laboratory wipe to wipe away any spills inside or around the cuvette port.
3. If there is excess lint or dust in or around the cuvette port, use canned air to clean out the cuvette port.
4. Ensure cuvettes are clean and free of scratches before use.
Note: Do not squirt water or any other liquid into the cuvette port for cleaning.
2.3 Blank Calibration
Procedure for Blank Calibration of Micro Volume Measurement
1. Open the upper cover of the instrument.
2. Make sure to insert the Blocking Stick in the cuvette port.
3. Gently pipette the blank sample onto the lower pedestal, close the upper cover.
4. Touch the button "  " on the measurement interface to perform blank calibration.
5. After completing the blank calibration, open the upper cover and wipe off the blank sample.
Procedure for Blank Calibration of Cuvette Measurement
1. Prepare the blank sample in a universal cuvette. The minimum volume of the sample is 1 ml.
2. Make sure to cover the lower pedestal with the Pedestal Cover.
3. Insert the cuvette in the cuvette port.
4. Touch the button "" to perform blank calibration.
5. After completing the blank calibration, open the upper cover and remove the cuvette.
Procedure for Blank Calibration of Cuvette Measurement
1. Prepare the blank sample in a universal cuvette. The minimum volume of the sample is 1 ml.
2. Make sure to cover the lower pedestal with the Pedestal Cover.
3. Insert the cuvette in the cuvette port.
4. Touch the button " " to perform blank calibration.
5. After completing the blank calibration, open the upper cover and remove the cuvette.
2.4 Keyboard
There is an internal keyboard functionality for the touch screen. However, users may make use of their own keyboard and mouse by connecting them through the USB ports located on the right side of the instrument.
The keyboard (Fig. 9) will automatically pop up when any letter box (e.g. title) is touched. When the button "  " that located at the bottom left corner of the keyboard is touched, it will convert to the number and special letter pad (Fig. 10). User can minimize the keyboard by touching the button "
  " that located at the upper right corner of the keyboard. User can also freely move the keyboard, by touching the button "
  " next to " ".

Figure 9

Figure 10
3. User Interface
3.1 Login
When the instrument is turned on, the Login interface will appear as above (Fig. 3-1). Users can enter their ID and Password, and touch the button "  " to login, or can login as a guest by touching the button "
  " without entering the User ID and Password for quick measurement.

Figure 11
User ID | User ID of the account. |
Password | Password of the account. |
| Login as an account with specified ID. |
| Login as a guest. |
Table 5
3.2 Main interface
When user login, the main operation interface will appear as above (Fig. 3-2). User can access to any measurement interface from the main interface.

Figure 12
| To enter Nucleic Acids measurement interface. (pg. 11) |
| To open Protein menu. (pg. 12) |
| To enter OD600 measurement interface. (pg. 16) |
| To enter End Point measurement interface. (pg. 16) |
| To enter Kinetic measurement interface. (pg. 17) |
| To enter Spectrum measurement interface. (pg. 17) |
| To open Account Settings panel. (pg. 21) |
| To open Search panel. (pg. 18) |
| To open Setup panel. (pg. 23) |
| To open Power Option panel. (pg. 22) |


Table 6
3.3 Submenu
There are submenus located at the top of every measurement interface

| Return to the Main interface. |
| To open Search panel. |
| To capture current screen and save it in the USB Flash Drive connected. (Refer to pg. 10) |
| To perform blank calibration. |
| To perform measurement according to the settings. |


Table 7
The button "  " is only in Nucleic Acids, Kinetic, Protein, and Spectrum interfaces.
User may capture a screenshot of the screen by touching the button " " in Nucleic Acids, Kinetic, Protein, Spectrum measurement interfaces, and save it as image files (.JPG) in a USB Flash Drive. The screenshot image files will be saved in the "Capture" folder under the "Biolab" folder.
Note: The USB Flash Drive must be plugged in one of the USB ports on the right side of the instrument before the capture operation.
3.4 Nucleic Acids Measurement
In Nucleic Acids measurement interface (Fig. 3-4), user can measure nucleic acids samples. There are various options for Nucleic Acids measurement: dsDNA, ssDNA, RNA, and Oligo.

Figure 13
| To measure double-stranded DNA samples. |
| To measure single-stranded DNA samples. |
| To measure RNA samples. |
| To measure Oligonucleotide samples. |
| Overlay Button: To enter Overlay interface. |
Title | Title of the measurement. |
Conc. | Shows the concentration of the sample. |
260nm (10mm path) | Shows the Abs. value at 260nm. |
280nm (10mm path) | Shows the Abs. value at 280nm. |
230nm (10mm path) | Shows the Abs. value at 230nm. |
260/280 ratio | Shows the calculated ratio of Absorbance values at the wavelength of 260 and 280nm. |
260/230 ratio | Shows the calculated ratio of Absorbance values at the wavelength of 260 and 230nm. |


Table 8
Procedure for Nucleic Acids Measurement
1. Enter Nucleic Acids measurement interface by touching the button "  " in the Main interface.
2. Touch and select the measurement item among dsDNA, ssDNA, RNA, and Oligo.
3. Input the title of the measurement.
4. Open the upper cover of the instrument.
5. Perform the blank calibration. (Refer to pg. 7)
6. Pipette microvolume of the target sample onto the lower pedestal and close the upper cover.
7. Touch the button "  " to start the measurement.
8. Check the results on the screen. The resulting data will be saved automatically and can be searched in the search panel.
Overlay with Nucleic Acids Measurement Results
Up to 5 results can be compared in Overlay interface (Fig. 3-5). Overlay interface is accessible by touching the button "  " in Nucleic Acids measurement interface. Follow procedure of Nucleic Acids measurement to proceed. Each measurement has different colors labeled for graph comparison. Each result will be saved individually, and multiple results can be loaded in Search for comparison. User can return to the measurement interface by touching the button " ".

Figure 14
3.5 Protein Measurement
In the main operation interface, user can touch the button "  " to open Protein menu . It allows user to choose and access to various measurement options: Bradford, Lowry, BCA, Biuret, Others, and Direct UV.

Figure 15
To close the menu, just retouch the button " " , or directly touch the button "  ".
".
| To enter Bradford measurement interface. (pg. 143) |
| To enter Lowry measurement interface. (pg. 14) |
| To enter BCA measurement interface. (pg. 14) |
| To enter Biuret measurement interface. (pg. 14) |
| To enter Others measurement interface, where user can set up the wavelength. (pg. 14) |
| To enter Direct UV measurement interface. (pg. 15) |


Table 9
3.5.1 Standard Curve
There is Standard Curve interface in Bradford, Lowry, BCA, Biuret, and Others under Protein measurement. It is necessary for the Standard Curve to be set before performing the measurements. User can touch the button "  " to enter the standard curve measurement interface (Fig. 3-7). Up to 5 concentration points of standard samples for measurements to generate the standard curve. However, the standard curve will be shown after completing measurement of 3 standard samples. User can also save, open, and reset the standard curve data by touching the buttons "
  ", "
", "  ", and "
  ".
".

Figure 16
| To enter the measurement interface. It is a default interface when user chose any protein measurement option. |
| To enter the standard curve interface for a standard curve setting. User can reset, load a standard curve for the measurement, or save current standard curve data. |
Conc. (mg/ml) | The concentrations (mg/ml) of Sample 1 to Sample 5. |
| To achieve the measurement Abs. values of Sample 1 to Sample 5. |
Abs. | Shows the Abs. values of Sample 1 to Sample 5. |
| Reset all the values in the standard curve interface. |
Wavelength (nm) | Shows the wavelength of the current measurement. |
| To open the saved standard curve data. |
| To save the current standard curve data and its settings. |

Table 10
Procedure for Standard Curve Measurement
1. Prepare at least 3 points of standard samples with different concentration to establish the standard curve.
2. Calibrate the blank.
3. Insert the target standard sample in a cuvette. (Minimum Volume: 1ml)
4. Touch the button "  " to measure.
5. When the measurement is complete, remove the sample.
6. Repeat the steps 3-5, and measure at least 3 standard samples.
3.5.2 Bradford, Lowry, BCA, Biuret, and Others
Besides Direct UV, there are various options for protein sample measurement Bradford, Lowry, BCA, and Biuret with certain measurement wavelength, and Others with a wavelength option. They have almost the same operation steps. In those measurement interface, user should establish a standard curve before the sample measurement.

Figure 17

Figure 18

Figure 19

Figure 20

Figure 21
Title | Title of the measurement. |
Conc. | Shows the concentration of the sample. |
Abs. | Shows the Abs. value of the sample. |
Wavelength | Shows the wavelength of the current measurement. (In Others protein measurement interface, user can set the measurement wavelength) |
Table 11
Procedure for Protein Samples Measurement
1. Enter certain protein measurement interface through the protein menu.
2. Input the title of the measurement.
3. Calibrate the blank.
(In Others protein measurement interface, user should set the wavelength before calibrating the blank)
4. Establish the standard curve.
5. Insert the target sample in a cuvette. (Minimum Volume: 1ml)
6. Touch the button " " to start the measurement.
7. Check the results on the screen. The resulting data will be saved automatically and can be searched in the search panel.
3.5.3 Direct UV
Direct UV measurement is based on the UV absorption properties of proteins. Unlike other protein sample measurements, the standard curve is not necessary for Direct UV measurement.

Figure 22
Title | Title of the measurement. |
Conc. | Shows the concentration of the sample. |
260nm (10mm path) | Shows the Abs. value at 260nm. |
280nm (10mm path) | Shows the Abs. value at 280nm. |
Table 12
Procedure for Direct UV Measurement
1. Enter the Direct UV measurement interface (Fig. 3-13).
2. Input the title of the measurement.
3. Calibrate the blank. (Refer to pg. 7)
4. Pipette microvolume of the target sample onto the lower pedestal and close the upper cover.
5. Touch the button " " to start the measurement.
6. Check the results on the screen. The resulting data will be saved automatically and can be searched in the search panel.
3.6 End Point and OD600 Measurement
End Point and OD600 measurement is to perform spectrometry measurements on samples such as cell culture samples.

Figure 24

Figure 25
Title | Title of the measurement. |
Wavelength | Shows the wavelength of the current measurement. (In End Point measurement interface, user can set the measurement wavelength) |
Time | Shows the list of measurement times. |
Mode | Shows the list of detection mode of the measurements. |
Title (in the data sheet) | Shows the list of measurement titles. |
Abs. | Shows the list of measurement Abs. values. |
Table 13
Procedure for END Point and OD600 Measurement
1. Enter END Point or OD600 measurement interface (Fig. 3-14 or Fig. 3-15).
2. Input the title of the measurement.
3. Calibrate the blank. (Refer to pg. 8)
(In End Point interface, user should set the wavelength before calibrating the blank)
4. Insert the target sample in a cuvette. (Minimum Volume: 1ml)
5. Touch the button " " to start the measurement.
6. Check the results on the screen. The resulting data will be saved automatically and can be searched in the search panel.
3.7 Kinetic Measurement
Kinetic measurement is to perform multiple spectrometry measurements on samples in accordance with certain wavelength and time lengths.

Figure 26
Title | Title of the measurement. |
Wavelength (nm) | Wavelength of the measurement between 200 -1100 nm. |
Measurement Time (min) | Total measurement time. |
Interval Time (sec) | Interval time between detections. |
Table 14
Procedure for Kinetic Measurement
1. Enter Kinetic measurement interface
2. Input the title of the measurement.
3. Set the wavelength, measurement time and interval time. User may calculate the detection amount by dividing measurement time with interval time and take integer part as the result. (e.g. if the measurement time is set to 1 minute, and interval time is set to 9 seconds, then there will be total 6 detections.)
4. Calibrate the blank. (Refer to pg. 8)
5. Insert the target sample in a cuvette. (Minimum Volume: 1ml)
6. Touch the button " " to start the measurement.
7. Check the results on the screen. The resulting data will be saved automatically and can be searched in the search panel.
3.8 Spectrum Measurement
Spectrum measurement is to perform spectrometry measurements with specified wavelength range.

Figure 27
Title | Title of the measurement. |
Wavelength (nm) | Input the wavelength range. |
| Search Abs value under the specified wavelength. |

Table 15
Procedure for Spectrum Measurement
1. Enter Spectrum measurement interface
2. Input the title of the measurement.
3. Set the wavelength range.
4. Calibrate the blank. (Refer to pg. 8)
5. Insert the target sample in a cuvette. (Minimum Volume: 1ml)
6. Touch the button " " to start the measurement.
7. Check the results on the screen. The resulting data will be saved automatically and can be searched in the search panel.
3.9 Search
User can access to Search panel from any measurement interface or the main interface. All the saved data can be searched in Search panel. There are various options for search. User can select the dates or choose the keywords of the title for the search.

Figure 28
Title Search | To find data under the title by matching keywords. |
Date & Time | To find data under specified dates and times. User can load a calendar by touching buttons "" and "" and select the date. |
Detection Mode | To find data under the selected detection mode. |
| Go back to previous page. |
| To find all the data under the selected detection mode. |
| To find all the data having properties of specified dates, title, and detection mode. |

Table 16
Search list panel is accessible by touching the button "  " or "
  " in Search panel. In this page, user can check the detailed information of data, edit their titles, delete the selected data, and transfer the data to a USB Flash Drive in FAT format. User also can select data to delete, or transfer, or check the overlay comparison between data. Selected data are checked. User can select to check certain or all the data by touching the button "
  " on the left of certain row or the top row in the page. Furthermore, user can go back to the previous search panel and come back to deselect all the data in the entire list of searched data.

Figure 29
| To load detailed information of the selected data. |
| Open a Change Title panel to change the title of the selected data. |
| Delete the selected data. |
| Transfer the displayed list to USB Flash Drive. The USB Flash Drive must be in FAT format. |
| Go back to previous page. |
| Select or deselect all the data on the page. |


 /
/ 
Table 17
3.9.1 Overlay in Search
Up to 5 results can be compared in Overlay interface. It is accessible by selecting multiple data from Nucleic Acids and Spectrum search list panel and touching the button "  ". Each measurement has different color labeled for graph comparison . In Spectrum Overlay panel, the data must share the same wavelength.

Figure 30

Figure 31
 Go back to previous page.
3.9.2 Data Transfer
Selected data or entire data on the list can be saved as .csv (Microsoft Excel) file in USB Flash Drive by touching "  " in the search list panel. During the process, a USB Flash Drive must be plugged in one of the USB ports on the right side of the instrument. The transferred files will be saved in the Biolab folder. for detailed location of the files. Nucleic Acids, Kinetic, Spectrum, and Direct UV will include Raw Data for each measurement in Raw Data folders.
Procedure for Data Transfer
1. Plug a USB Flash Drive in one of the USB ports on the right side of the instrument.
2. Load files for transferred in Search panel.
3. Select the data to be transferred on the search list. (Skip this step if you are transferring the entire data on the search list)
4. Touch the button " " to open the transfer option panel
5. Touch "  " to transfer all the data on the list or "
  " to transfer the selected data.
6. Input a name for the transferred file
7. Find the files in Biolab folder . Each file will be titled as the name input during the process


Figure 32

Figure 33

Figure 34
3.10 Account Setting
User can access to Account panel by touching the button "" in the main interface. In Account panel, user can swap the current account, create a new account, edit the selected account, or delete the selected account . Master account cannot be deleted. However, its password can be changed in Setup panel.

Figure 35
Current ID | Shows ID of current login account. |
| Swap between the current account to the selected account. |
| Create a new account. |
| Edit ID and passwords of selected account. |
| Delete the selected account. |
| Return to the main interface. |


Table 18
3.11 Power Panel
User can access to Power panel by touching the button "  " in the main interface.
User can put the instrument in a sleep mode. User can also turn off the system in Power panel.
NOTE: IT IS VERY IMPORTANT to turn off the power by touching the button "  " in Power panel after using the instrument. When it is completely shut down, turn off the power switch at backside of the instrument. If the power is forcibly turned off by the power switch without software shutdown, the recovery mode from the OS might occur during the reboot. User can select the screen design for the sleep mode.

Figure 36
| To put the system in a sleep mode. |
| Turn off the system. |
| Return to the main interface. |


Table 19
3.12 Setup
User can access to Setup panel by touching the button "  " in the main interface. User can set the time, update the interface, change Master Password, check System Information, and calibrate the instrument.
NOTE: Setup is not recommended for users to access the panel and change features without manufacturer's supervision.

Figure 37
| Change the time in the system. |
| Update the interface. |
| Delete all the data in the system, however, the accounts will remain. |
Calibration | Adjust the setting of the system. DO NOT CHANGE THE SETTINGS without manufacturer's supervision. |
| Change the master password. |


