
Get Price

Single Beam UV Visible Spectrophotometer BSSBV-202-B
- • 2.5 inches High-Definition LCD Display
- Standard curve and test results are clearly displayed.
- • High-quality Tungsten Lamp and Deuterium Lamp
- Longer service life, much more stable.
- Lower stray light, higher photometric accuracy.
- • Quick to Establish Standard Curve
- Quick to establish a standard curve and measure the unknown samples.
- • Easy Data Output by USB/Parallel Port
- Up to 3-Year Product Warranty
- US & EU Compliance Standards
- Door-to-Door Shipping
Technical Specifications
Detailed operating and construction parameters for this model.
| Model | BSSBV-202-B |
| Wavelength Range | 190-1000nm |
| Spectral Bandwidth | 2nm |
| Wavelength Accuracy | ±2nm |
| Optical System | Single beam, grating 1200 lines/mm |
| Wavelength Repeatability | ≤0.5 nm |
| Wavelength Setting | Automatically |
| Wavelength Resolution | 0.1 nm |
| Photometric Accuracy | ±0.5%T |
| Photometric Repeatability | ≤0.2%T |
| Photometric Range | -0.3-3A, 0-200%T, 0-9999C |
| Photometric Mode | T, A, C, F |
| Stray Light | ≤0.1%T at 220 nm & 360 nm |
| Stability | ≤0.002A/30 min at 500 nm |
| Display | 128*64 Dots LCD |
| Detector | Silicon Photodiode |
| Light Source | W Lamp & D2 Lamp |
| Output | USB port & Parallel Port |
| Power Requirements | AC 85~250V |
Product Features
Key design, performance, usability, and safety advantages.
Items Included Review the standard components and accessories supplied with this product.
| Name | Quantity | Unit |
| 1cm Glass cuvette | 4 | pcs |
| 1cm Quartz cuvette (only UV model) | 2 | pcs |
| Power cord | 1 | pcs |
| User's manual | 1 | pcs |
| Dust cover | 1 | pcs |
Operating Manual View instructions, operating procedures, safety information, and maintenance guidance.
1 Introduction
2 Installation
2.1.System configuration Requirement
2.2 Software Installation
2.3 Software Uninstall
3 Basic Application
3.1 Run the software
3.2 Main interface
3.3 Menu bar and Toolbar
3.4 User and User Privileges
3.5 Data processing
4 Instrument Control
4.1 Connect/Release PC
4.2 Set the wavelength
4.3 Calibrate the wavelength
4.4 Set switching point of the light source
4.5 Turn on/off Deuterium lamp
4.6 Turn on/off Tungsten lamp
4.7 Dark Current Detection
4.8 Energy Detection
5 Measurement Operation
5.1 Standard Curve
5.2 Photometric Analysis
5.3 Quantitative Analysis
1 Introduction
MetaSpec Pro analysis software is a new version of PC software for UV-Vis or Visible spectrophotometer written by professional software engineers of our company.
We reserve all rights of this software. No reproduction by any means is allowed without acknowledgement.
The MetaSpec Pro analysis software has powerful functions, such as instrument control, measurement, data analysis and data processing. User management, file security and 3D spectrogram are also available.
The main measurement functions contain Standard Curve, Photometric Analysis, Quantitative Analysis, Kinetics Analysis, Wavelength Scan, Multi-wavelength Analysis and DNA/Protein Analysis.
With this software, user can control the instrument, set parameters, complete measurement and other relative operation conveniently.
2 Installation
This chapter will show users the requirement of system configuration and the steps of installation and uninstall for MetaSpec Pro analysis software.
2.1.System configuration Requirement
Following system configuration of PC is required:
• Core i3 dual-core or faster processor
• CD-ROM drive
• 2 USB interface
• 2G or more RAM
• 1G or more hard disk space
• Microsoft Windows 7 or Windows 8 operating system (Also support Windows XP)
2.2 Software Installation
Install MetaSpec Pro analysis software with following steps:
Step 1: Put the CD of MetaSpec Pro analysis software into CD-ROM drive of PC.
Step 2: In the CD-ROM root directory, double-click "MetaSpec_Pro_EN_Setup.exe." to start the installation progress. Click [Next] in the setup dialog, select "I accept the terms in the license agreement", and click [Next] to continue the installation progress.
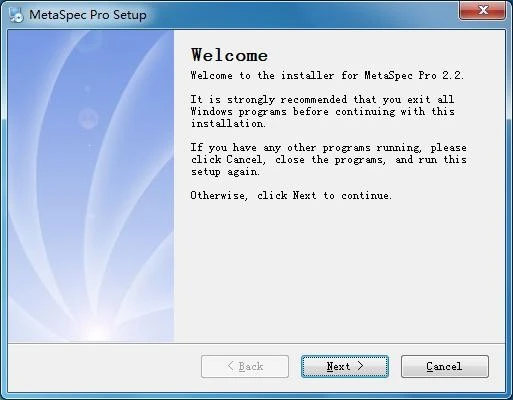
Figure 1
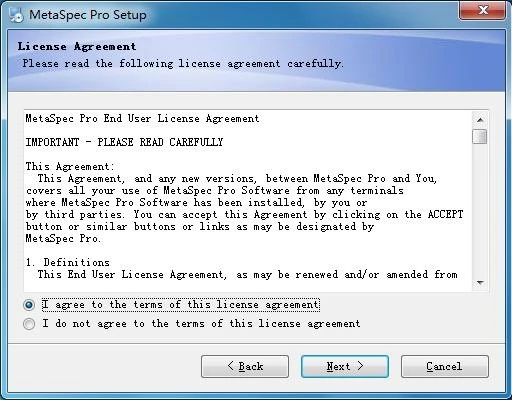
Figure 2
Step 3: Click [change…] button to select the installation directory, then click [Next], it's ready to install MetaSpec Pro analysis software. Click [Next] to proceed with the installation. It will create a shortcut folder on the Desktop after installing files, and then it will suggest that the installation
is successful.
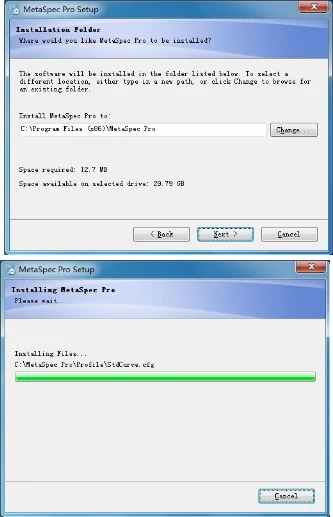
Figure 3
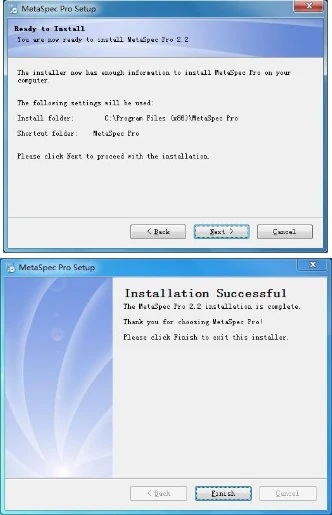
Figure 4
Step 4: The final installation process contains the installation of CP210x USB driver, click [Install] to install it. If the CP210x USB driver has already installed, it will give a notice, just click [OK] to update the driver. At last, click [Finish] to exit the installation process of MetaSpec Pro analysis software.
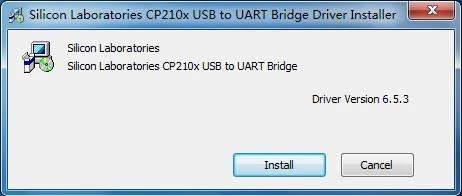
Figure 5
![Figure 6, There are two ways to safely uninstall MetaSpec Pro analysis software., One way, through [Control Panel], enter](https://biolabscientific.com/content/manual/20260714001/Figure-6-i7-Biolab.webp "Figure 6")
Figure 6
2.3 Software Uninstall
There are two ways to safely uninstall MetaSpec Pro analysis software.
One way, through [Control Panel], enter the [Add or Remove Programs] dialog, select [MetaSpec Pro], and click the [uninstall] button.The other way, in the [Start] menu, select [MetaSpec Pro] and [Uninstall MetaSpec Pro] in [All Programs], and the uninstall progress will automatically uninstall the MetaSpec Pro software.
3 Basic Application
This chapter will show users the basic application of MetaSpec Pro analysis software, such as how to run the software, be familiar with the interface and tools, and manage the user information.
3.1 Run the software
There are two ways to run MetaSpec Pro analysis software. Make sure that the UV Key has already been inserted to user's computer, then, run MetaSpec Pro analysis software.
One way, double-click the shortcut icon ![Figure 6, There are two ways to safely uninstall MetaSpec Pro analysis software., One way, through [Control Panel], enter](https://biolabscientific.com/content/manual/20260714001/Figure-6-i8-Biolab.webp "Figure 6") on the Desktop to run the program.
on the Desktop to run the program.
The other way, in the [Start] menu-> [All Programs] -> [MetaSpec Pro] -> [MetaSpec Pro], click [MetaSpec Pro] to run the program. For the first launch, user can login the system with the user name "admin" and password "a12345". User also can click the button ![Figure 6, There are two ways to safely uninstall MetaSpec Pro analysis software., One way, through [Control Panel], enter](https://biolabscientific.com/content/manual/20260714001/Figure-6-i9-Biolab.webp "Figure 6") in the login window to enter the main interface of the software. For the next launch, user can login the system with a new user name and a new password. About modification of the user name and password, please refer to chapter 3.4.
in the login window to enter the main interface of the software. For the next launch, user can login the system with a new user name and a new password. About modification of the user name and password, please refer to chapter 3.4.
Note: Only administrators have the right to manage the user and user privileges. Login with the user name "admin" and password "a12345" is suggested for the first launch.
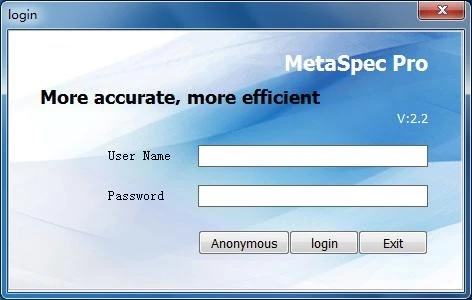
Figure 7
When entering the interface of the software, a window for parameters of the device will be shown.
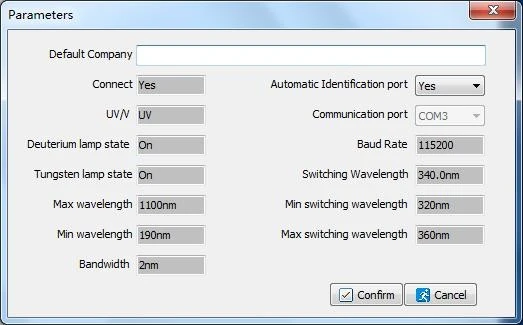
Figure 8
User can view the parameters and modify the Company name. Whether choose the Automatic Identification port or not also can be set up. Finally, click the button  to exit the parameters window. User also can close the window directly without any modification.
3.2 Main interface
The main interface of the software is described as following:
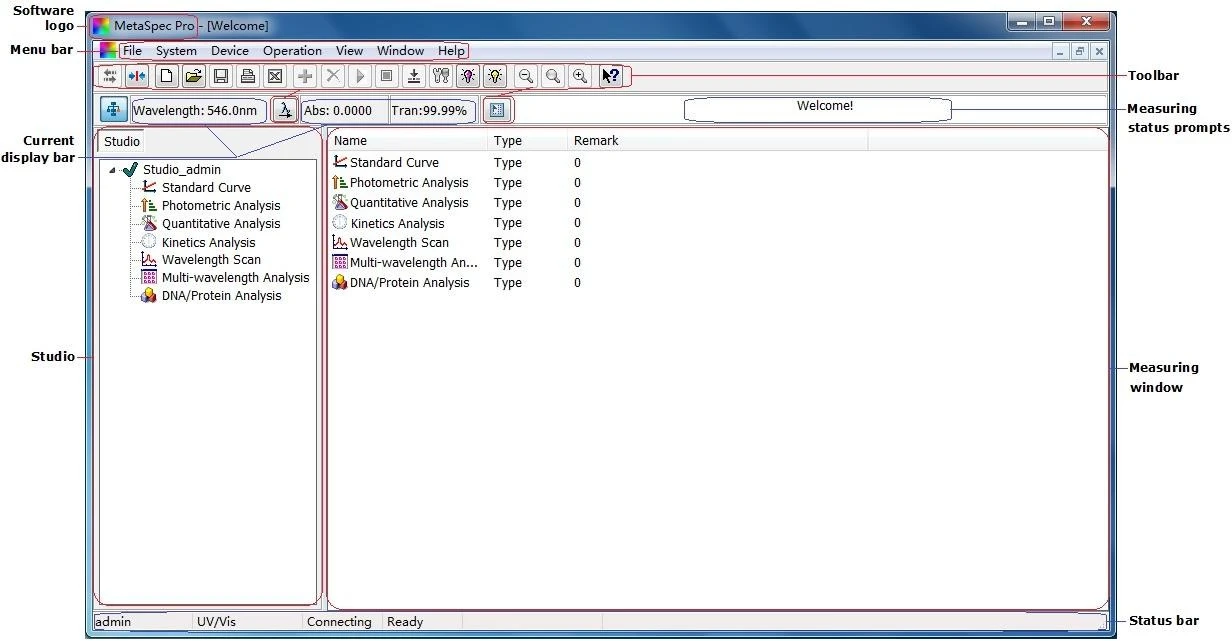
Figure 9
3.3 Menu bar and Toolbar
This software provides the Menu bar and Toolbar to user for easy access to different functions. At the same time, the pop-up menu of right click includes most commonly used functions to speed up user's operation.
3.3.1 Menu bar
The menu bar contains File, System, Device, Operation, View, Window and Help, respectively shows as following:
1) File & The drop-down menu
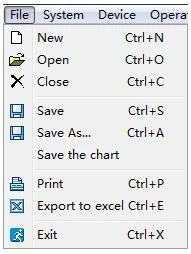
Figure 10
2) System & The drop-down menu
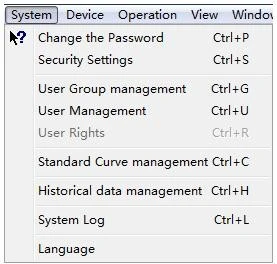
Figure 11
3) Device & The drop-down menu
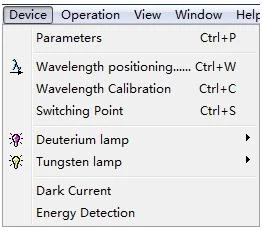
Figure 12
4) Operation & The drop-down menu
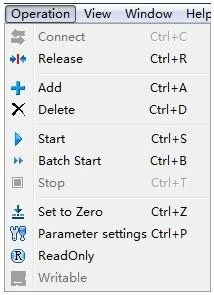
Figure 13
5) View & The drop-down menu
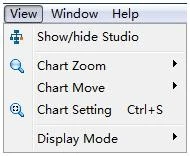
Figure 14
6) Window & The drop-down menu
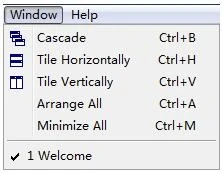
Figure 15
7) Help & The drop-down menu
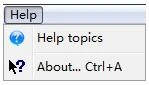
Figure 16
3.3.2 Toolbar
The toolbar contains all icons that described as following:
Item | List | Icon | descriptions |
File management | New | | Create a new file. |
Open | | Open the file with saved test data. | |
Save | | Save the file with test data. | |
| Print the test report. | ||
Export | | Export the test report to Excel. | |
Operation | Connect | | Connect the device. |
Release | | Release the device. | |
Add | | Add a row to the datasheet for a new test. | |
Delete | | Delete the test record. | |
Start | | Start the measurement. | |
Batch start | | Start a batch measurement. | |
Stop | | Stop the measurement. | |
Zero / Baseline | | Set zero and do blank calibration or baseline calibration. | |
Set wavelength | | Set the operating wavelength. | |
Read only | | The file can be read only. | |
Writable | | The file is writable and can be modified. | |
User privileges | | Set user privileges. |


Table 1
Item | List | Icon | descriptions |
Information viewing | Parameter settings | | View the parameter settings. |
Tungsten lamp | | Show the status (on/off) of tungsten lamp. | |
Deuterium lamp | | Show the status (on/off) of deuterium lamp. | |
About | | Software version information and product ID information. | |
Message list | | Report messages about running conditions of the software. | |
Spectrum management | Zoom in | | Zoom in the spectrum. |
Reset | | Reset the spectrum. | |
Zoom out | | Zoom out the spectrum. | |
Move left | | Make the spectrum move left. | |
Move up | | Make the spectrum move up. | |
Move down | | Make the spectrum move down. | |
Move right | | Make the spectrum move right. | |
Graph settings | | Set graphical parameters. | |
Display mode | Absorbance |
| Choose absorbance as displaying mode. |
Transmittance | | Choose transmittance as displaying mode. | |
Concentration | | Choose concentration as displaying mode. |





Table 2
3.3.3 Pop-up menu of right click
When right click at the data sheet in the measuring window, there will be a pop-up menu that includes most commonly used functions to speed up user's operation. The pop-up menu of right click is shown as following:
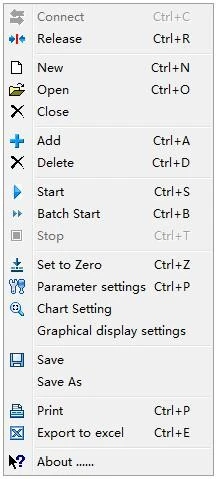
Figure 17
3.4 User and User Privileges
In the system of MetaSpec Pro analysis software, the management of user and user privileges is based on user groups. Create user groups first, and set the user privileges. Then, create user data. The user privileges are determined by the user group that the user belongs to. There are two default user groups in the system, administrator group and guest group. The administrator group has the most privileges and the default privileges can't be edited. Only the users in administrator group can enter following interfaces: Security Settings, User Group management, User Management and User Rights.
3.4.1 Password modification
Select the main menu [System] -> [Change the Password], and enter the password modification window. Input the old password and the new password, then input the new password again, and click the button to complete the modification. So that user can launch the system with the new password next time.
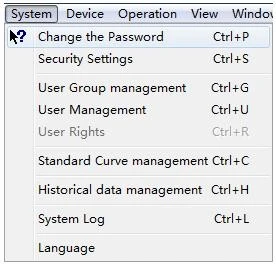
Figure 18
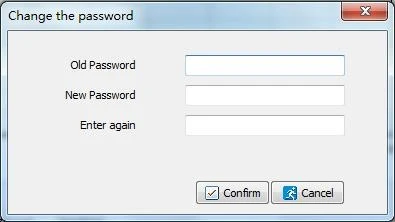
Figure 19
3.4.2 User group management
Select the main menu [System] -> [User Group management], and enter the user group management window. There are two default user groups in the system, administrator group and guest group. User can browse the information of each user group by double click when the cursor points to the corresponding group. User can click the shortcut icon  in the toolbar to create a new user
group. Input the group name and user quantity, then click the button to save the new information.
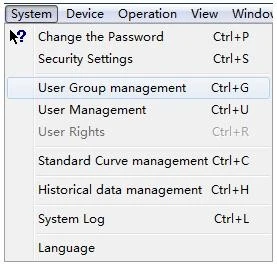
Figure 20
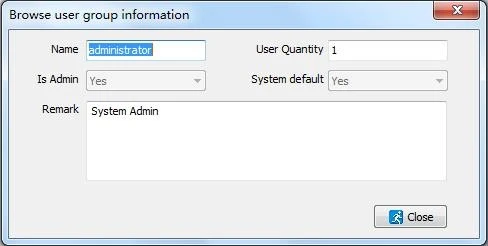
Figure 21
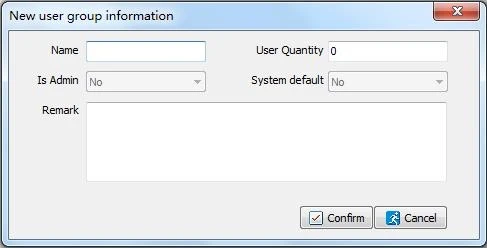
Figure 22
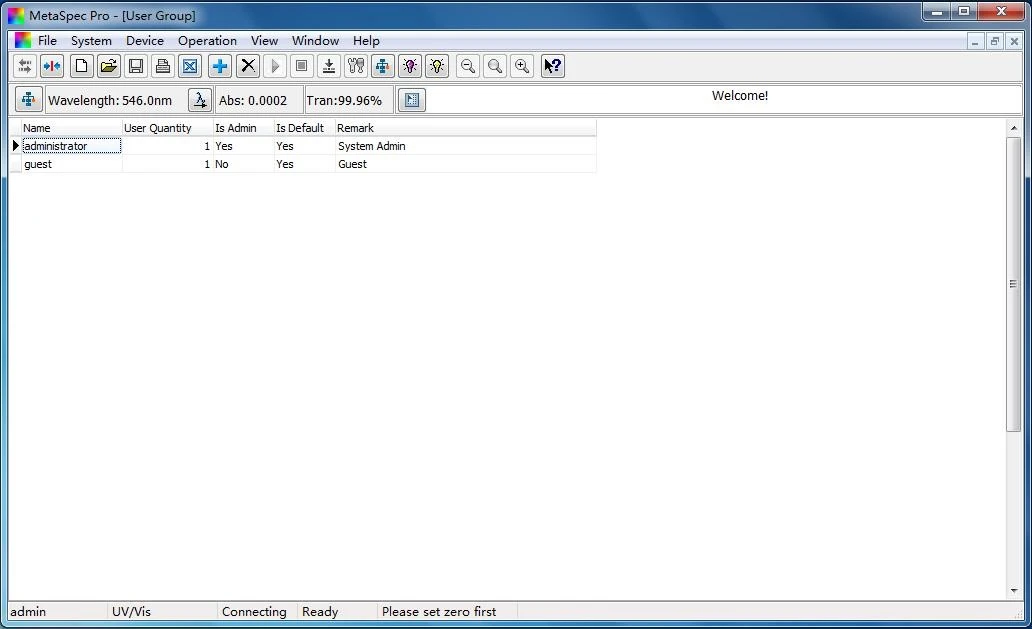
Figure 23
3.4.3 User management
Select the main menu [System] -> [User Management], and enter the user management window. User can browse the information of each user by double click when the cursor points to the corresponding user. User can click the shortcut icon in the toolbar to create new user
information, such as input Code, Name, Department, Tel (Telephone), E-mail, etc. Click the button to save the information. User can login the system with the code as user name and the new password a12345 so that the new information can be used on test report when printing.
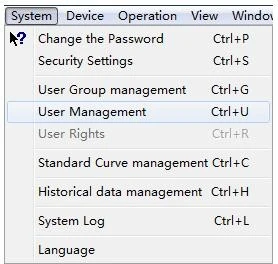
Figure 24
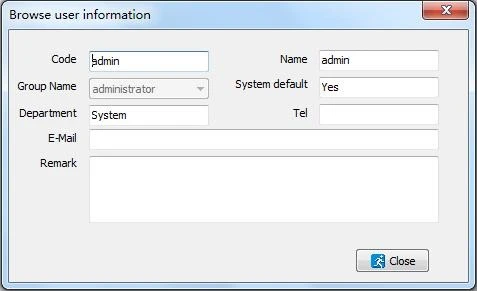
Figure 25
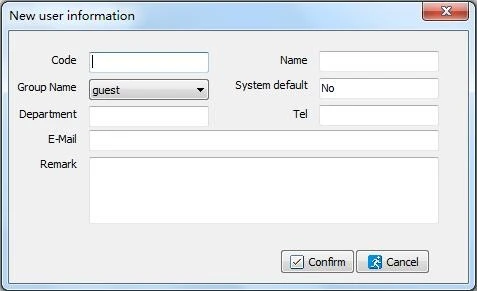
Figure 26
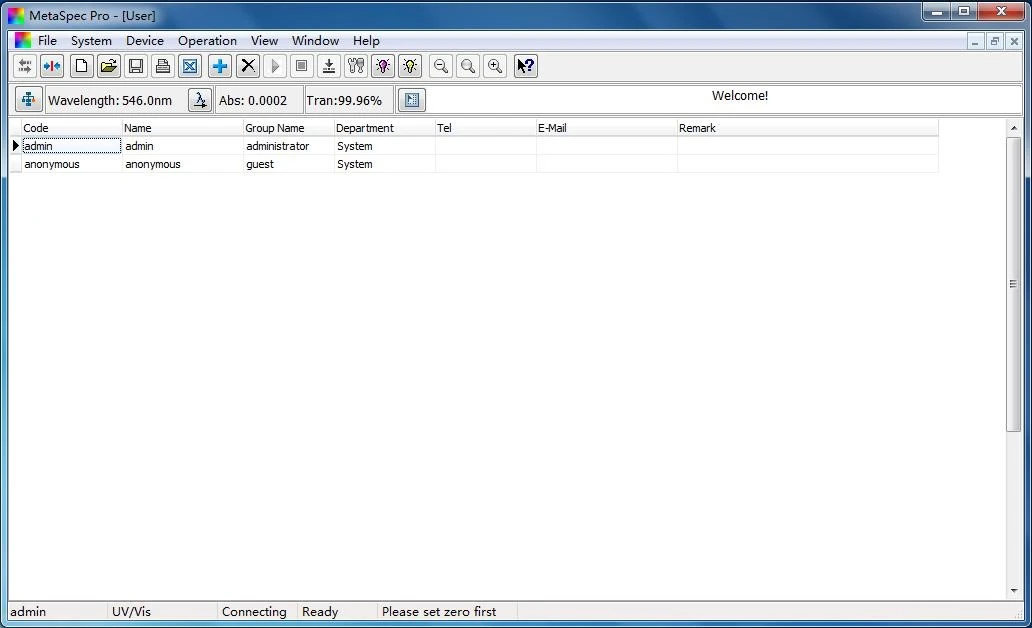
Figure 27
3.4.4 User rights
In the user group management interface, the further management of user rights is available. User can browse the user rights of administrator group without editing by clicking the shortcut icon  in the toolbar when the cursor points to administrator group. User can browse the user rights of guest group by clicking the shortcut icon in the toolbar when the cursor points to guest group, and edit the user access rights.
In the user access rights editing window, double click to change the status of user access right when the cursor points to the row that need editing, then click the button to make sure the editing and exit the window. It's also available to manage the user rights by selecting the main. menu [System] -> [User Rights] when the cursor points to some group in the user group management interface.
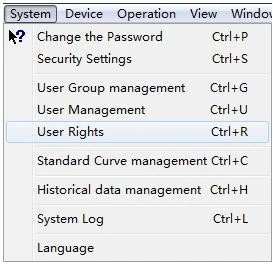
Figure 28
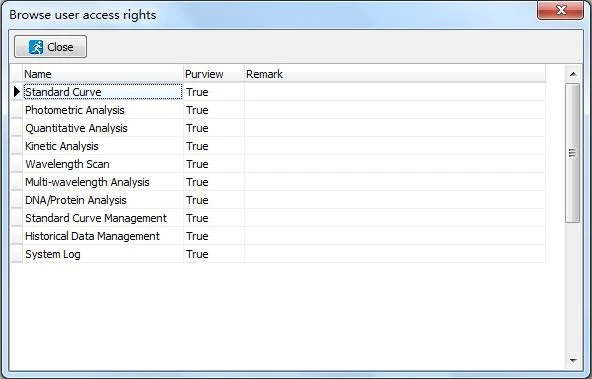
Figure 29
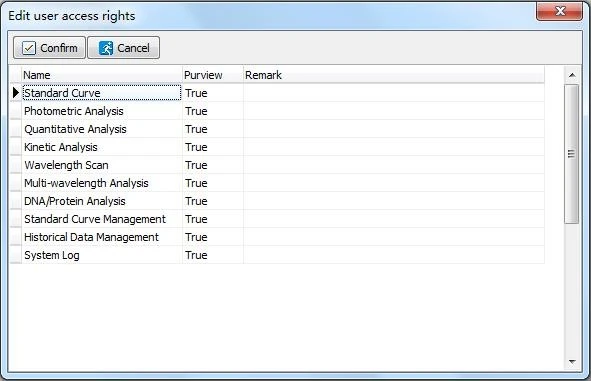
Figure 30
3.4.5 System security setting
Select the main menu [System] -> [Security Settings], and enter the security settings window. The system security such as Password lifetime, Password length, and Security can be set up.
The default path of the data file is "D:\MetaSpec". The data will be saved in the folder of "DataFile" automatically. User also can save the file to other path.
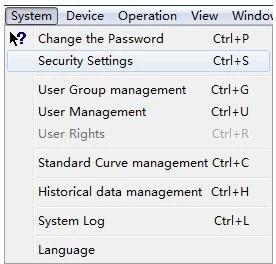
Figure 31
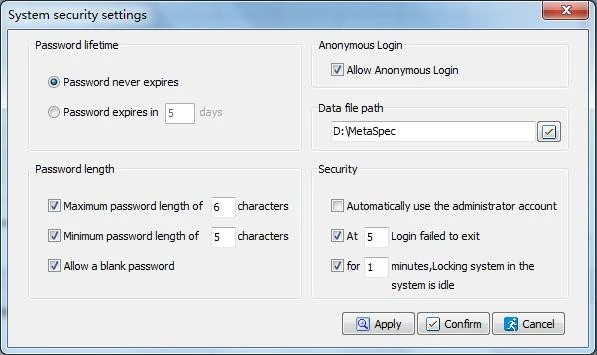
Figure 32
3.5 Data processing
The MetaSpec Pro analysis software has a powerful function of Data processing, such as creating a new test file, Data saving, Data opening, Data printing, and exporting the data to Excel. The graph also can be saved separately for subsequent processing.
All the spectrum contain standard curve, time scanning curve and wavelength scanning curve can be zoomed in, zoomed out or reset freely. Moving left, right, up or down is also at will.
Graph settings, such as setting the coordinates range and 3D Effect is available. For a wavelength scanning curve, peak and valley marking, and characteristic value marking are also available.
4 Instrument Control
This chapter will show users how to control the instrument with MetaSpec Pro analysis software, such as Connect/Release PC, set wavelength, set switching point of the light source, turn on/off Deuterium lamp and turn on/off Tungsten lamp.
4.1 Connect/Release PC
Connect PC: Before connecting, connect the instrument and PC with USB Cable,and insert the UV Key to user's computer. Switch on the power of the instrument. After Diagnostic program and Warm up procedure, it will go into the Main Menu.
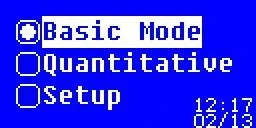
Figure 33
Main menu of BSSBV-202-A,BSSBV-202-B series
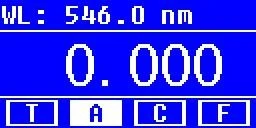
Figure 34
Main menu of BSSBV-202-A, BSSBV-202-B (B)
Then, run MetaSpec Pro analysis software, it will search the communication port, and connect the instrument automatically. Otherwise, click the shortcut icon  [Connect] in the toolbar, or operate in the main menu [Operation] -> [Connect].
Release PC: Click the shortcut icon  [Release] in the toolbar, or operate in the main menu [Operation] -> [Release] to release the instrument.
![Figure 35, Figure 36, Select the main menu [Device] -> [Wavelength positioning……], or click the shortcut icon in the toolbar](https://biolabscientific.com/content/manual/20260714001/Figure-35-i72-Biolab.webp "Figure 35")
Figure 35
Figure 36
4.2 Set the wavelength
Select the main menu [Device] -> [Wavelength positioning……], or click the shortcut icon ![Figure 35, Figure 36, Select the main menu [Device] -> [Wavelength positioning……], or click the shortcut icon in the toolbar](https://biolabscientific.com/content/manual/20260714001/Figure-35-i73-Biolab.webp "Figure 35") in the toolbar to set the operating wavelength, it will pop up a dialog.
in the toolbar to set the operating wavelength, it will pop up a dialog.
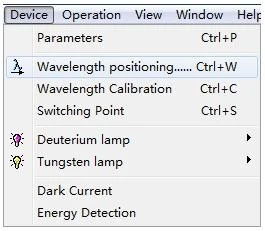
Figure 37
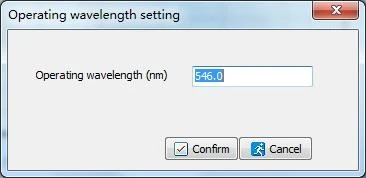
Figure 38
Input the wavelength value and click the button to confirm the setting. Then, the device will go to the setting position, and it will be shown in the current display bar.
4.3 Calibrate the wavelength
Select the main menu [Device] -> [Wavelength Calibration] to calibrate the wavelength. There will be a dialog. Click the button  to start the calibration, a further message will be given.
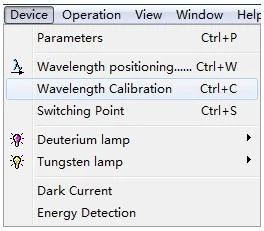
Figure 39
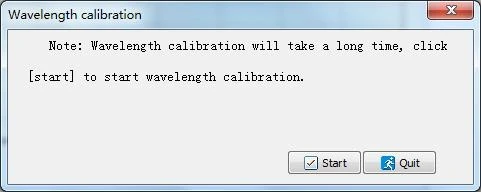
Figure 39
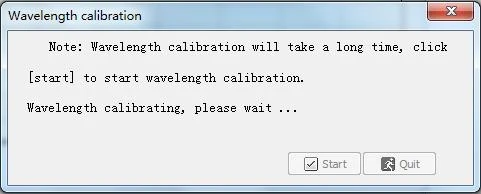
Figure 40
Click the button ![Click the button to exit the dialog of wavelength calibration., Select the main menu [Device] -> [Switching Point] to set](https://biolabscientific.com/content/manual/20260714001/Click-the-button-to-exit-the-dialog-of-wavelength-calibration.-i80-Biolab.webp "Click the button to exit the dialog of wavelength calibration.") to exit the dialog of wavelength calibration.
to exit the dialog of wavelength calibration.
4.4 Set switching point of the light source
Select the main menu [Device] -> [Switching Point] to set the switching point of the light source. The valid range is from 320nm to 360nm.
![Click the button to exit the dialog of wavelength calibration., Select the main menu [Device] -> [Switching Point] to set](https://biolabscientific.com/content/manual/20260714001/Click-the-button-to-exit-the-dialog-of-wavelength-calibration.-i81-Biolab.webp "Click the button to exit the dialog of wavelength calibration.")
Figure 41
![Figure 42, Select the main menu [Device] -> [Deuterium lamp] -> [Off] to turn off Deuterium lamp. Then, the status of](https://biolabscientific.com/content/manual/20260714001/Figure-42-i82-Biolab.webp "Figure 42")
Figure 42
4.5 Turn on/off Deuterium lamp
Select the main menu [Device] -> [Deuterium lamp] -> [Off] to turn off Deuterium lamp. Then, the status of Deuterium lamp will be
shown as ![Figure 42, Select the main menu [Device] -> [Deuterium lamp] -> [Off] to turn off Deuterium lamp. Then, the status of](https://biolabscientific.com/content/manual/20260714001/Figure-42-i83-Biolab.webp "Figure 42") in the toolbar. Otherwise, select the main menu [Device]
in the toolbar. Otherwise, select the main menu [Device]
-> [Deuterium lamp] -> [On] to turn on Deuterium lamp. Then, the status of Deuterium lamp will be shown as ![Figure 42, Select the main menu [Device] -> [Deuterium lamp] -> [Off] to turn off Deuterium lamp. Then, the status of](https://biolabscientific.com/content/manual/20260714001/Figure-42-i84-Biolab.webp "Figure 42") in the toolbar.
in the toolbar.
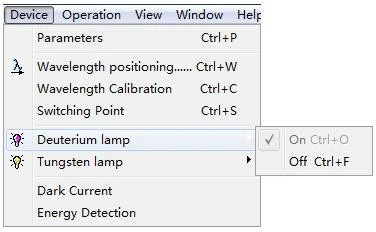
Figure 43
![Figure 44, Select the main menu [Device] -> [Tungsten lamp] -> [Off] to turn off Tungsten lamp. Then, the status of Tungsten](https://biolabscientific.com/content/manual/20260714001/Figure-44-i86-Biolab.webp "Figure 44")
Figure 44
4.6 Turn on/off Tungsten lamp
Select the main menu [Device] -> [Tungsten lamp] -> [Off] to turn off Tungsten lamp. Then, the status of Tungsten lamp will be shown as ![Figure 44, Select the main menu [Device] -> [Tungsten lamp] -> [Off] to turn off Tungsten lamp. Then, the status of Tungsten](https://biolabscientific.com/content/manual/20260714001/Figure-44-i87-Biolab.webp "Figure 44") n the toolbar. Otherwise, select the main menu [Device] -> [Tungsten lamp] -> [On] to turn on Tungsten lamp. Then, the status of Tungsten lamp will be shown as
n the toolbar. Otherwise, select the main menu [Device] -> [Tungsten lamp] -> [On] to turn on Tungsten lamp. Then, the status of Tungsten lamp will be shown as ![Figure 44, Select the main menu [Device] -> [Tungsten lamp] -> [Off] to turn off Tungsten lamp. Then, the status of Tungsten](https://biolabscientific.com/content/manual/20260714001/Figure-44-i88-Biolab.webp "Figure 44") in the toolbar.
in the toolbar.
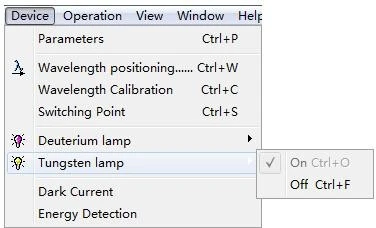
Figure 45
![Figure 46, Select the main menu [Device] -> [Dark Current] to detect the dark current. The system will read the dark energy](https://biolabscientific.com/content/manual/20260714001/Figure-46-i90-Biolab.webp "Figure 46")
Figure 46
4.7 Dark Current Detection
Select the main menu [Device] -> [Dark Current] to detect the dark current. The system will read the dark energy at different gain automatically. User can read the data of dark current again by clicking the button ![Figure 46, Select the main menu [Device] -> [Dark Current] to detect the dark current. The system will read the dark energy](https://biolabscientific.com/content/manual/20260714001/Figure-46-i91-Biolab.webp "Figure 46") in the dark current displaying window.
in the dark current displaying window.
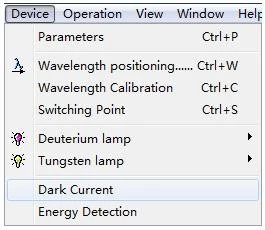
Figure 47
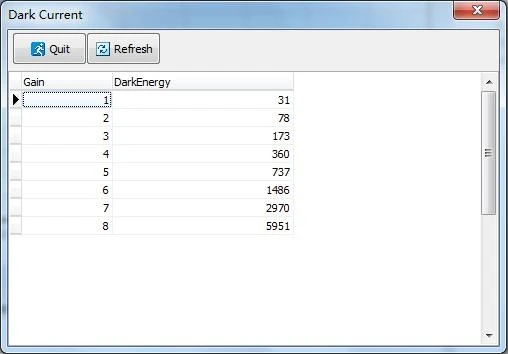
Figure 48
4.8 Energy Detection
User can do energy scanning by the function of energy detection. The self-testing of bandwidth also can be done. Select the main menu [Device] -> [Energy Detection] to enter the interface of energy detection. User can set scanning parameters such as Start wavelength, End wavelength, Interval and Scan times, and select suitable Light Source in the energy detection setting window.
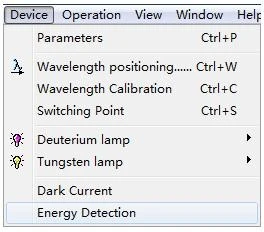
Figure 49
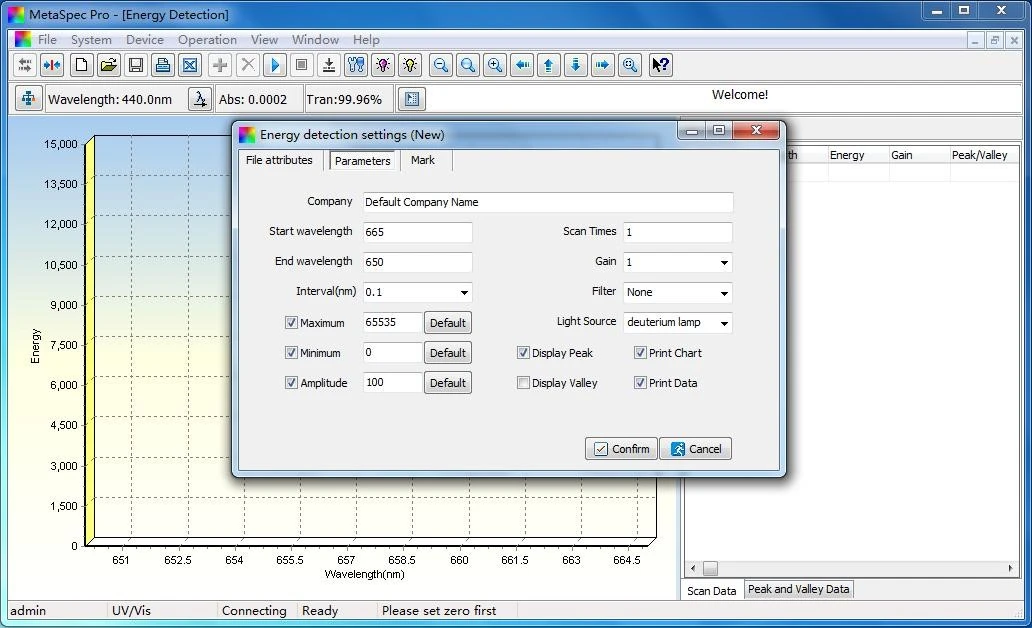
Figure 50
5 Measurement Operation
This chapter will show users the main measurement functions of the software such as Standard Curve, Photometric Analysis, Quantitative Analysis, Kinetics Analysis, Wavelength Scan, Multi-wavelength Analysis and DNA/Protein Analysis.
It contains all the procedures of each measurement function. The operations are also available through pop-up menu of right click in the data sheet after entering each measurement interface.
5.1 Standard Curve
A calibration curve will be established by measuring the absorbance of a group of standard solutions. Four fitting methods as following can be chosen to establish the standard curve: Linear fit through zero, Linear fit, Quadratic fit and Cubic fit.
5.1.1 Measurement for Standard Curve
1. Select Standard Curve in the Studio, and click the shortcut icon  in the toolbar to set parameters and create a new standard curve file. User also can double click Standard Curve in the Studio directly to create a new file. There will be a child window for standard curve settings.
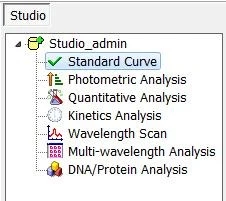
Figure 51
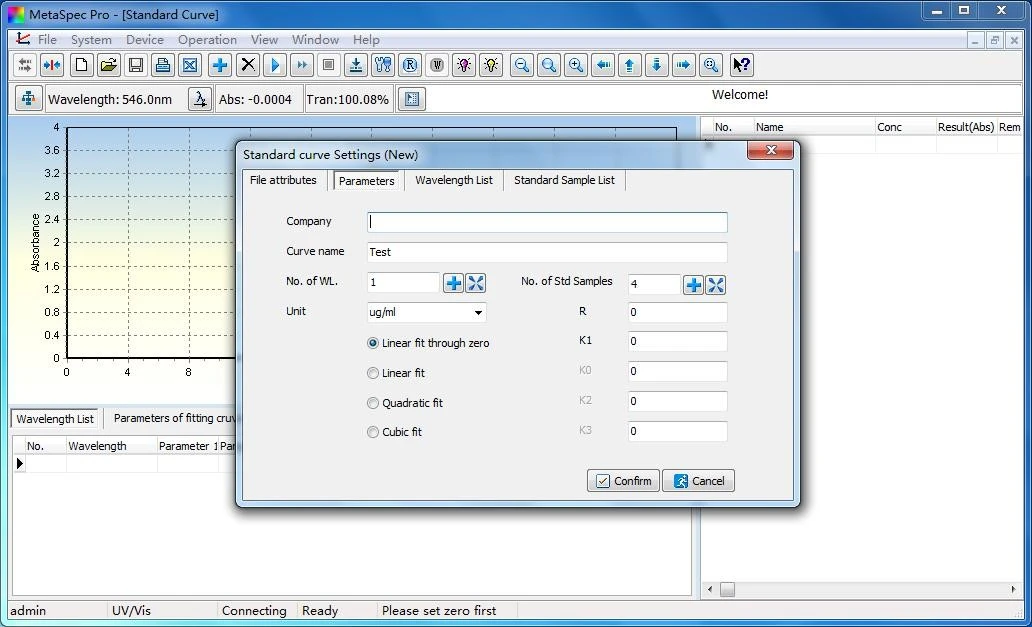
Figure 52
2. Set parameters such as choosing Fitting method and Unit, setting Number of wavelengths and Number of standard samples.
3. Set up the wavelength(s) and calculation parameters in the window of Wavelength list: Click the setting bar and input the wavelength value when the cursor points to it, and press Enter key to confirm the setting. Set the calculation parameters with the same
operations. User can click the shortcut icon and set up more wavelengths, the wavelength also can be deleted by clicking the shortcut icon 
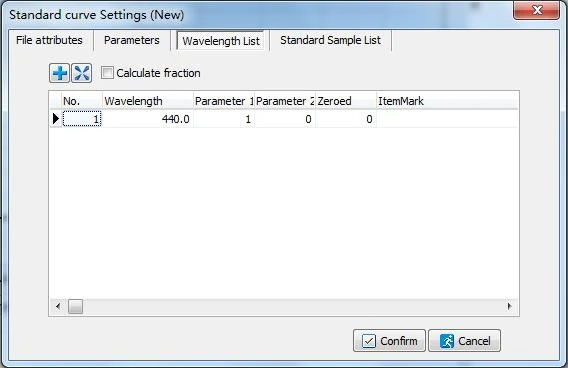
Figure 53
Set up the concentration of standard samples in the window of Standard sample list: Click the setting bar and input the values of standard concentration when the cursor points to Conc. Column, and press Enter key to confirm each setting. User can click the shortcut icon and set up more standard samples, the standard samples also can be deleted by clicking the shortcut icon
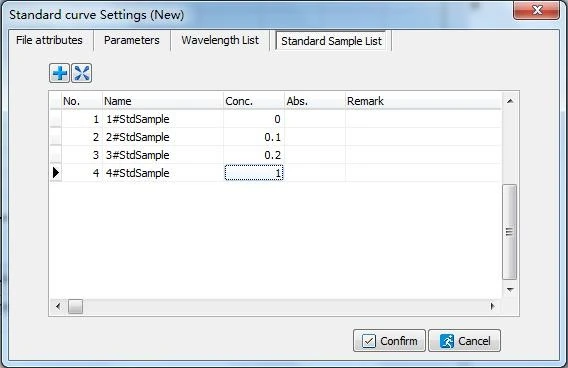
Figure 54
Then, confirm the settings by clicking the button in the child window.
5. Put the Reference solution of standard samples into the light path,click the shortcut icon
 n the toolbar, the device will go to the operating wavelength first, then the system will calibrate the blank and set to 0.000Abs/100.0%T.
6. Measuring with single wavelength: Put one Standard sample solution into the light path, and click the shortcut icon  in the toolbar to start the measurement when the cursor points to the corresponding concentration. The absorbance (Abs) will be recorded in Abs. column. Measure other Standard sample solutions with the same operations. Click the shortcut icon
in the toolbar to start a batch measurement if measuring with several wavelengths.
User can view the standard curve in graphics area after all standard samples have been measured. And the parameters of fitting curve containing correlation coefficient will be shown in the window below the graphics area.
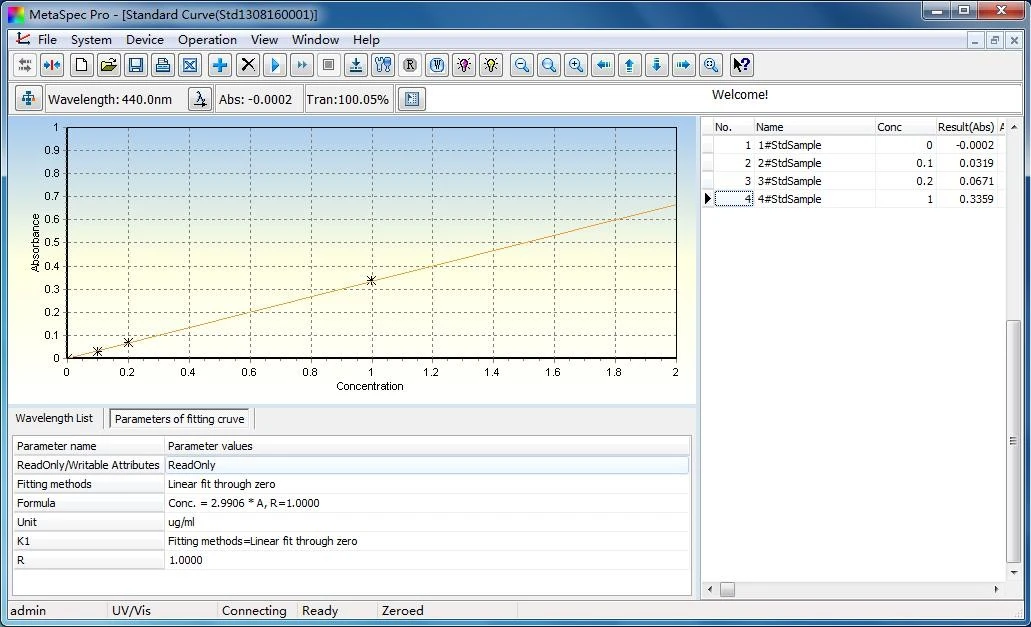
Figure 55
7. After the measurement is completed, click the shortcut icon  in the toolbar to save the test data. The file will be saved in ".Std" format. Click the shortcut icon
  in the toolbar to print the test report. The data also can be exported to Excel by clicking the shortcut icon
  in the toolbar.
5.2 Photometric Analysis
The values of Absorbance (Abs) and Transmittance (T) are available with this function. The value of concentration is also available by selecting the option of "Calculate the concentration".
5.2.1 Measurement for Photometric Analysis
1. Select Photometric Analysis in the Studio, and click the shortcut icon in the toolbar to set parameters and create a new photometric analysis file. User also can double click Photometric Analysis in the Studio directly to create a new file. There will be a child window for photometric analysis settings.
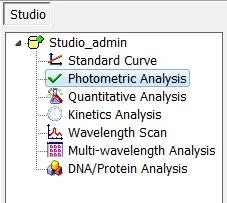
Figure 56
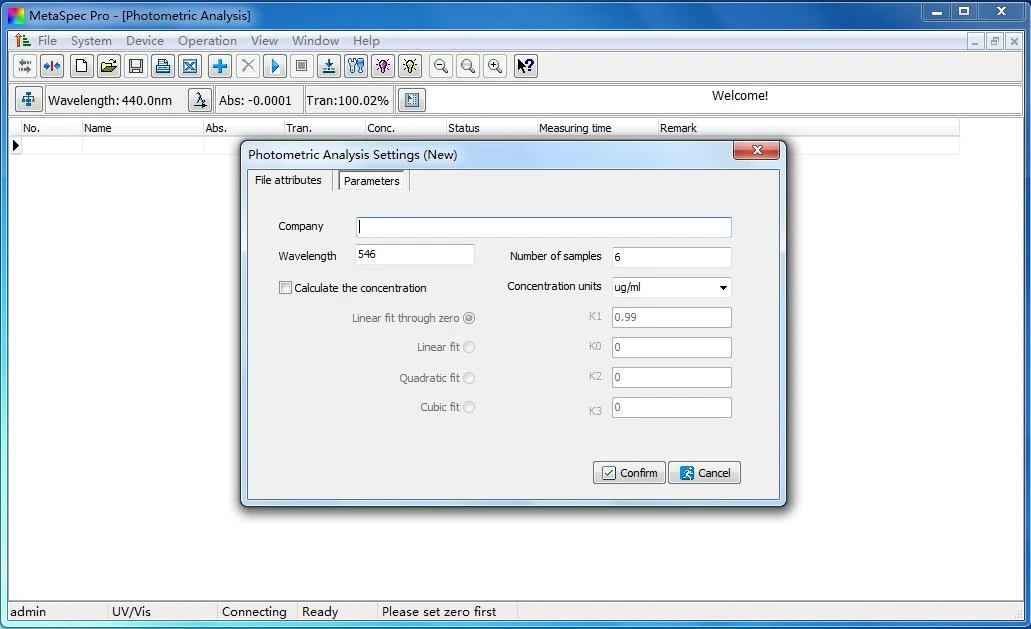
Figure 57
2. Set parameters such as Wavelength, Number of samples and concentration calculating factors if choosing "Calculate the concentration". Then, confirm the settings by clicking the button in the child window.
3. Put the Reference solution into the light path, click the shortcut icon in the toolbar, the device will go to the operating wavelength first, then the system will calibrate the blank and set to 0.000Abs/100.0%T.
4. Put the Sample solution into the light path, click the shortcut icon in the toolbar to start the measurement. The result containing
Absorbance (Abs.) and Transmittance (Tran.) will be displayed in the data sheet. If the option of "Calculate the concentration" was chosen, the Concentration (Conc.) result will be displayed together.User can click the shortcut icon in the toolbar and measure more samples, the sample record also can be deleted by clicking the shortcut icon in the toolbar.
5. After the measurement is completed, click the shortcut icon in the toolbar to save the test data. The file will be saved in ".Pht" format. Click the shortcut icon in the toolbar to print the test report. The data also can be exported to Excel by clicking the shortcut icon
in the toolbar.
5.3 Quantitative Analysis
Two methods can be chosen for quantitative analysis: Standard Curve method and Coefficient method.
1) Standard Curve method
About Standard curve, please refer to chapter 5.1. User can load the standard curve that has already been established and saved before, and measure samples with the same parameters.
2) Coefficient method
Coefficient method is a simple application of standard curve. Just choose the suitable calculation method and input the coefficient(s) of the equation in the parameter setting window, then begin the test.
5.3.1 Measurement for Quantitative Analysis
1. Select Quantitative Analysis in the Studio, and click the shortcut icon in the toolbar to set parameters and create a new
quantitative analysis file. User also can double click Quantitative Analysis in the Studio directly to create a new file. There will be a child window for quantitative analysis settings.
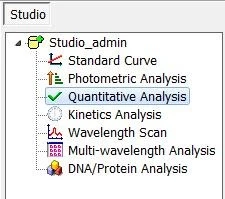
Figure 58
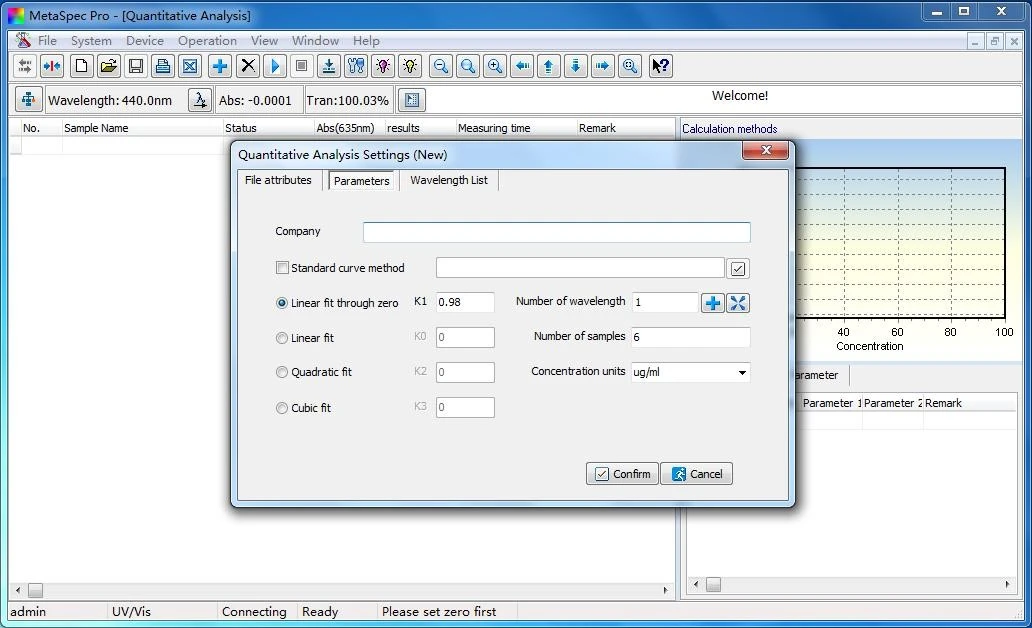
Figure 59
2. In the child window, set parameters such as choosing Calculation method, Number of wavelength, setting Wavelength(s), Number of samples and selecting suitable Concentration units. Load the standard curve by clicking the button  under the choice box if
Standard curve method was chosen as the calculation method. Otherwise, select the fitting method and set the factors.
3. Set up the wavelength(s) and calculation parameters in the window of Wavelength list: Click the setting bar and input the wavelength value when the cursor points to it, and press Enter key to confirm the setting. Set the calculation parameters with the same
operations. User can click the shortcut icon and set up more wavelengths, the wavelength also can be deleted by clicking the shortcut icon .
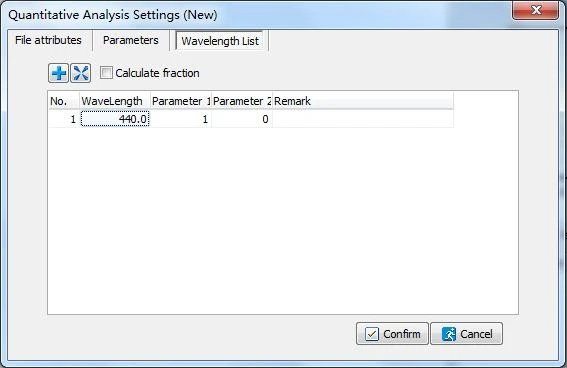
Figure 60
Then, confirm the settings by clicking the button in the child window.
Note: When Standard curve method was chosen, the parameter(s) of wavelength(s) has also been saved with the standard curve. So user needn't set the wavelength(s) any more.
4. Put the Reference solution into the light path, click the shortcut icon in the toolbar, the system will calibrate the blank and set to 0.000Abs/100.0%T at the operating wavelength.
5. Put the Sample solution into the light path, and click the shortcut icon in the toolbar to start the measurement. The result containing Absorbance (Abs.) and Concentration (Conc.) will be displayed in the data sheet.
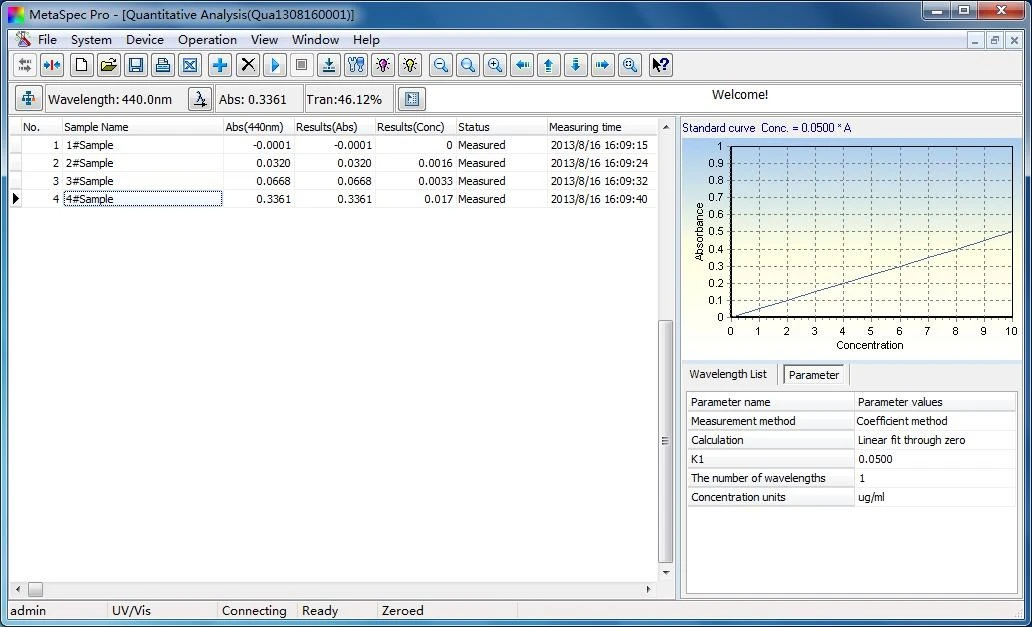
Figure 61
After the measurement is completed, click the shortcut icon  in the toolbar to save the test data. The file will be saved in "Qua" format. Click the shortcut icon in the toolbar to print the test repo