
Get Price
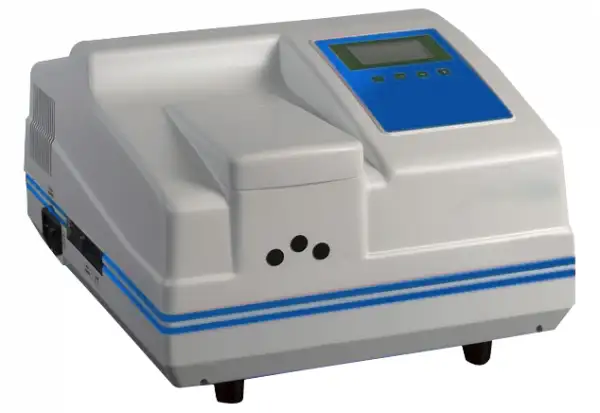
Fluorescence Spectrophotometer BSFL-103
Biolab Fluorescence spectrophotometers incorporate excellent wavelength accuracy and highly reliable optical performance to give highest sensitivity, reproducibility and accuracy. Xenon lamp minimizes photobleaching of samples thus maintaining sample integrity and produces high signal to noise ratio to give unmatched performance even with trace samples....
- Powerful Software Functions.
- Up to 3-Year Product Warranty
- US & EU Compliance Standards
- Door-to-Door Shipping
Technical Specifications
Detailed operating and construction parameters for this model.
| Model | BSFL-103 |
| Wavelength Range | 250-700nm |
| Spectral Bandwidth | 10nm |
| Wavelength Accuracy | ±1nm |
| Wavelength Repeatability | ≤0.5 nm |
| Stability | Better than 1.5% per 10 min |
| Light Source | Xenon Lamp |
| Excitation Optical Filter | Interference optional filter of central wavelength at 365nm; optional interference filter of 25mm diameter of wavelength range 250-700nm |
| Excitation Wavelength Range | 250-700 nm |
| Emission Wavelength Range | 200-900 nm |
| Linearity | R ≥ 0.995 |
| Response Time | 0.1-4 sec |
| Monochromator | Czerny Turner Diffraction Grating |
| Gross Dimension (W/D/H) | 380x440x240 mm |
| Weight (Net/Gross) | 14 kg |
| Power | 190 W |
| Power Supply | 220V±22V, 50Hz±1Hz |
Product Features
Key design, performance, usability, and safety advantages.
Applications Explore common laboratory, research, industrial, and process applications.
It serves a wide range of demanding clinical research, molecular biology, pharmaceutical and industrial applications.
Operating Manual View instructions, operating procedures, safety information, and maintenance guidance.
1. Alert Symbols of Safe Operation
2. Appearance and Performances of the Instrument
2.1 Appearance of the Complete Instrument and Main Components
2.2 Operating Panel of the Instrument
2.3 Working Principles of the Instrument
2.4 Measurement Functions of the Instrument
2.5 Performance Index of the Instrument (Specifications)
3. Operation of the Instrument
3.1 Operation of the Instrument Panel
3.2 Normally Working Condition of Startup
3.3 Measurement
4. Installation of the Instrument
4.1 Installation Environment
4.2 Unpacking for Checking
4.3 Installation
4.4 Adjustment of Instrument
5. Maintenance of the Instrument
5.1 Routine Maintenance
5.2 Maintenance and Replacement of Light Source Lamp
5.3 Maintenance and Replacement of Filter
6. Environmental Requirements of Using Software and Installation
6.1 Basic Configuration of Computer Hardware and Software
6.2 Installation of "BSFL-103 Software"
7. Operation of Software
7.1 Operation of Software
7.2 Three Interfaces of Working Mode
8. Operation of Wavelength Scan Mode (Connected with a Computer)
8.1 The Interface of Wavelength Scan Mode
8.2 Wavelength Scanning Operation
1. Alert Symbols of Safe Operation
 Symbols indicate important information on operating the instrument safely.
Please read carefully and operate according to the instructions following.
 Symbol indicates a potential hazard to the electrical appliances through the operation, and indicates that a qualified professional man is needed to deal with such a hazard according to the corresponding procedures. (This label is attached to the power switch and trigger.)
 Symbol indicates heating on the surface. Please perform cautiously according to the instructions following.
Points for Attention to Operation
1. The BSFL-103 Fluorospectrophotometer is suitably used in a laboratory room to perform analytical measurements. If the instrument needs to be used at a worksite, the working environment of the worksite should accord with the demands of the laboratory environment.
2. If the user needs to move the instrument to another working site for analytical measurements, please use original packing materials on moving.
3. Be sure to turn on∕off the power of the instrument according to the operating procedure. When starting up the instrument, please turn on the power source of the xenon lamp first. Then turn on the power source of the spectrophotometer main unit after the xenon lamp is lit. When shutting down the instrument, please turn off the power source of the spectrophotometer first and then the power source of the xenon lamp. Otherwise, the instrument may not work normally. After the xenon lamp is lit, it is necessary to wait for 30 minutes over till the lamplight becomes stable. After the power source of the xenon lamp is turned off, please wait for 60 seconds, and then turn on the lamp if the lamp needs to be used again.
4. When the power source of the xenon lamp is turned on but the lamp fails to be lit and a squeaking sound of high frequency or a cracking sound of sparking is produced continuously, please turn off the power source of xenon lamp immediately and wait for several seconds, then turn on the lamp again. Because the life of the xenon lamp is closely related to the number of on-off of the lamp power source, the lamp should avoid being turned on/off repeatedly under a high voltage and the unnecessary number of on/off of the xenon lamp power source should be cut down as far as possible.
5. When the instrument is working, the surface temperature of the heat dissipation opening at the top of the left back side of the instrument (xenon lamp position) becomes very high. Be sure not to touch the surface of the heat dissipation opening with your hands in order not to be burnt. The air around the heat dissipation opening should be kept circulating.
6. After each startup of the instrument, please first confirm that the heat dissipation fan at the side of the instrument runs normally in order to ensure normal work of the instrument. If the user finds anything wrong with the heat dissipation fan, the instrument should be closed down for an overhaul.
7. In order to protect the photomultiplier when PMT level is higher (>6), do not let high light pass into the sample compartment. When a sample of unknown concentration is measured, PMT level should be set from low grade to high grade (1-17) gradually.
8. After PMT level is adjusted, the original set for zero-point of fluorescence should be checked
and note that zero-point adjustment may be needed again.
9. When and only when a computer error is due to the operator¹s false operation or other interferences, the power switch of the spectrophotometer main unit should be turned off immediately. When the software cannot be operated, please use the task manager to end the process, then restart the software and the instrument.
10. Within the monochromator the tightened screws must not be loosened. The optical devices and the working environment of the instrument should be kept clean.
11. When opening the cover to inspect the instrument, be sure to turn off the power source. Particularly after the upper cover of the instrument is removed, as there are electrical appliance parts with high voltage located at the left back of the instrument base, be sure not to contact these parts while the power source is still turned on.
2. Appearance and Performances of the Instrument
2.1 Appearance of the Complete Instrument and Main Components
2.1.1 The Complete Instrument
Operating Panel
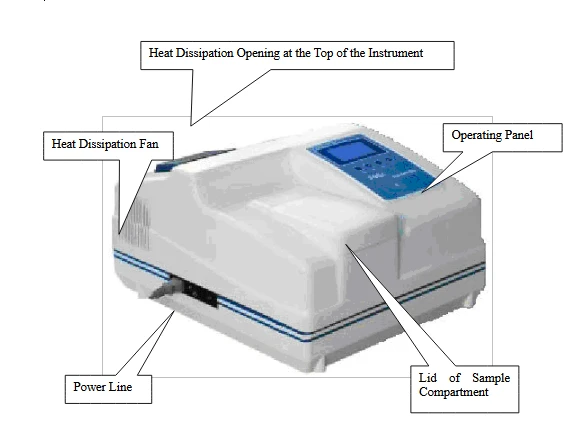
Figure 1
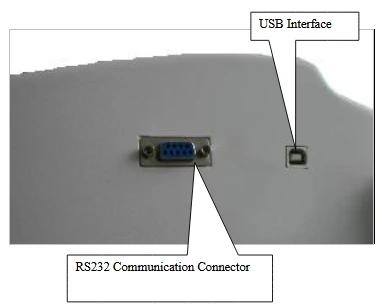
Figure 2 (Fluorospectrophotometer Main Unit)
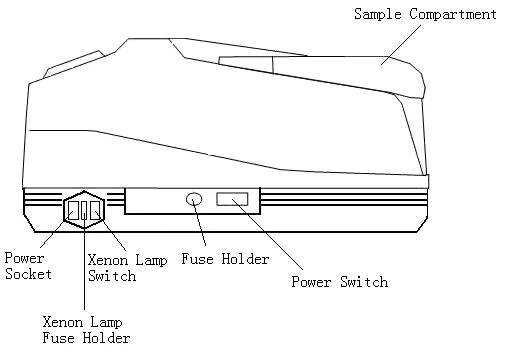
Figure 3 (The Left Side View of Fluorospectrophotometer Main Unit)
Sample Compartment (inside it a cell holder used to hold a sample cell), Power Switch (used to turn on/off the power source of the instrument), Fuse Holder (used to mount a fuse), Power Socket (used to interconnect a feed cable), Xenon Lamp Switch (used to turn on/off the Xenon lamp).
Main Components
1. Xenon Lamp
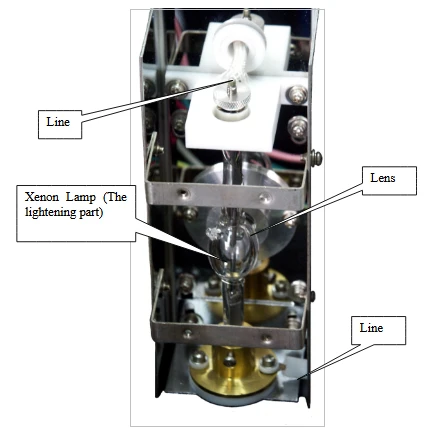
Figure 4 (Xenon Lamp and Lamp Holder)
2. Sample Compartment
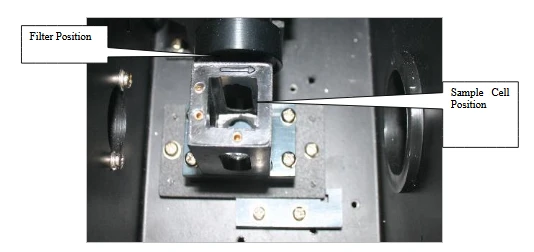
Figure 5
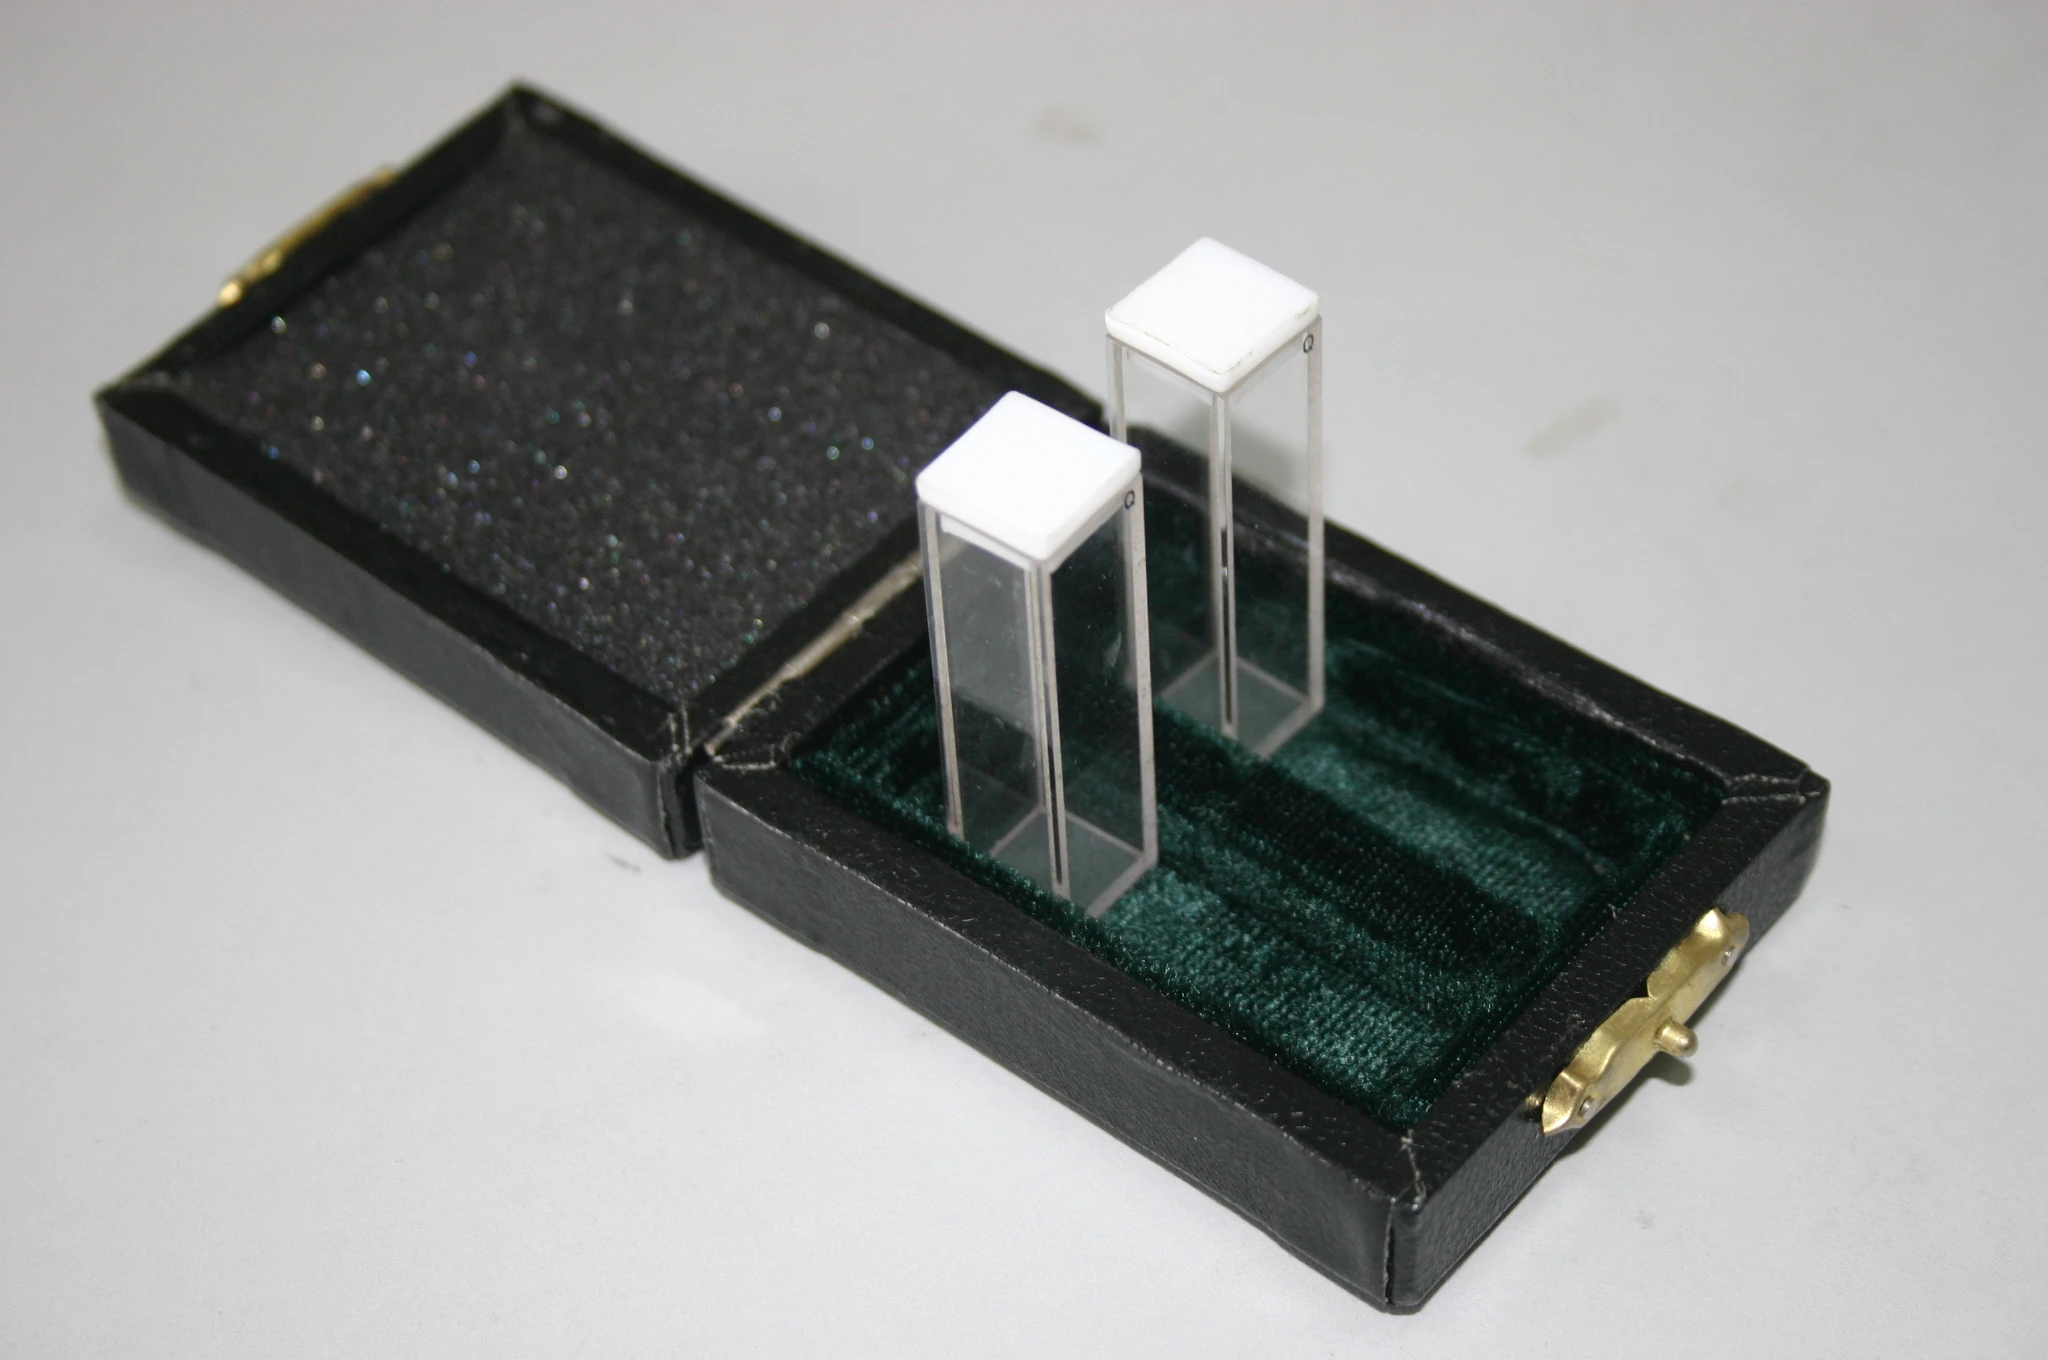
Figure 6 (Sample Compartment and Quartz Sample Cell 10 mm)
3. Filter
![Figure 7 [Filter (center wavelength 365 nm)], Figure 8 (Operating Panel of Fluorospectrophotometer Main Unit) BSFL-103](https://biolabscientific.com/content/manual/20260910001/Figure-7-Filter-center-wavelength-365-nm-i11-Biolab.webp "Figure 7 [Filter (center wavelength 365 nm)]")
Figure 7 [Filter (center wavelength 365 nm)]
2.2 Operating Panel of the Instrument
![Figure 7 [Filter (center wavelength 365 nm)], Figure 8 (Operating Panel of Fluorospectrophotometer Main Unit) BSFL-103](https://biolabscientific.com/content/manual/20260910001/Figure-7-Filter-center-wavelength-365-nm-i12-Biolab.webp "Figure 7 [Filter (center wavelength 365 nm)]")
Figure 8 (Operating Panel of Fluorospectrophotometer Main Unit)
1. Mode key
2. Print key
3. Adj 0% key
4. Normalize key
5. Display Window.
2.3 Working Principles of the Instrument
Signal Processing and Control System
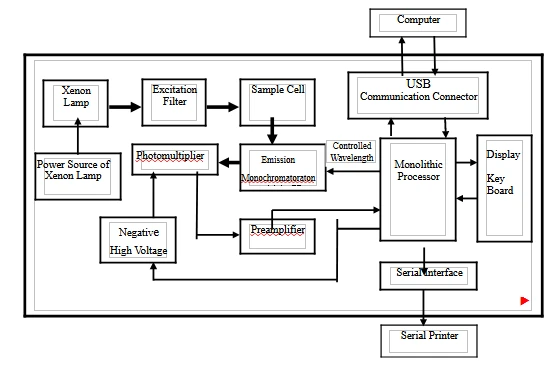
Figure 9 ( Signal Processing and Control System)
Optical System
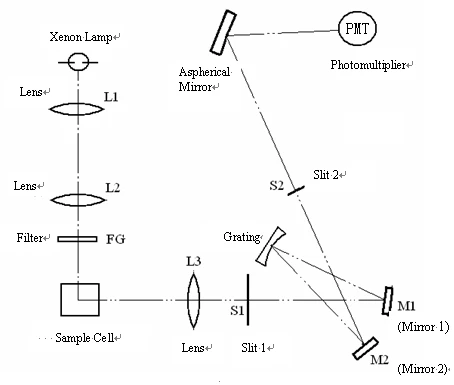
Figure 10 (Optical System Arrangement of Fluorospectrophotometer)
2.4 Measurement Functions of the Instrument
2.4.1 Working Modes of Measurement
1. Wavelength scan mode. At a fixed excitation wavelength a spectrum is obtained in which the fluorescent intensity of a sample varies with wavelength.
2. Time scan mode. At a fixed excitation wavelength, a spectrum is obtained in which the fluorescent intensity of a sample varies with time.
3.Quantitative analysis mode. According to the quantitative relationship of fluorophotometry F=KC, under a given experimental condition, fluorescent intensity (F) is directly proportional to the concentration (C) of a sample component to be determined. By measuring the fluorescent intensity of a standard solution, K is acquired by curve fitting. Then measure the fluorescent intensity of an unknown sample. From a quasi-linear equation calculate the concentration of the component to be determined in the unknown sample. A calibration can also be made by standard curve method or standard addition method.
A concentration measurement can be made through direct reading from the instrument by a single-point standard calibrating method.
2.4.2 Modes of Data Measurement
1. Measuring with a single instrument. By using the functions of the keys and the functional indicator lights on the instrument panel, read the measured data on the display window.
2. Measuring with an on-line computer. The instrument is connected with a computer through a communication connector. The instrument control, the parameters setting, and real-time measurement are all carried out by a computer software system. The software possesses powerful functions of spectrum processing, data processing and storage.
Note: For different modes of data measurement, the number of usable working modes and the convenience of use differ somewhat.
2.4.3 Self-checking and Self-correcting
1. Self-checking and self- correcting function of the instrument
The instrument will automatically initialize after startup, including self-checking and wavelength correcting. Self-checking contains on-line condition check, excitation source check, database module check, DAC module check, PMT module check and motor module check. The result of each check will be printed on the LCD or in the software window when connected to the computer. Users can check out problems referred to tables. Wavelength correcting programs will guarantee the accuracy of wavelength.
2.5 Performance Index of the Instrument (Specifications)
Light source | 150W Xenon lamp (consumable part) |
Excitation filter | Filter character: ±5nm labeled (An interference filter with center wavelength 365nm used as standard configuration. Users may separately purchase other φ25mm interference filters with center wavelength within 200―850nm range.) |
Emission monochromator | Emission monochromator wavelength range: (Em) 200―900nm Wavelength accuracy within ±1nm Wavelength repetition ≤0.5nm Emission spectrum bandwidth: 10nm |
S∕N ratio | S/N≥150 (Using 1cm quartz sample cell, measure the signal noise ratio of Raman spectrum of water ) |
Check utmost | 1x10⁻¹⁰ g/ml sulfuric acid quinine solution |
Measure linearity | ≥0.995 |
Peak value | ≤1.5% |
Zero line drift | ≤0.3% (Within 10 minutes) |
Upper limit change of indicating value | ±1.5% (Within 10 minutes) |
Power requirement | 220V±22V 110V/60HZ |
Dimensions | 442x392x250(mm) |
Weight | Net weight 11kg |
Gross weight 13kg |
Table 1 (Performance Index of the Instrument)
3. Operation of the Instrument
3.1 Operation of the Instrument Panel
1. Display Window
The display window is a 128*64 pixels LCD, shows information including initialization status, fluorescence value, concentration value, emission wavelength value, PMT level, concentration factors, standard concentration, etc.
Symbol related:
1. "•" means the excitation light source is on.
2. "%" means the fluorescence value has been normalized.
2. Operation of the Function Keys
1. "Mode" Key : Select the operation mode. The switch circulation is as follows: Fluorescence Value Mode -> Wavelength Mode -> PMT Level Adjust -> Concentration Input Mode -> Factors Input Mode -> Concentration Mode -> Fluorescence Value Mode.
In Wavelength Mode and PMT Level Adjust, if the parameter value set is different from current value, use the "Mode" key to cancel the current value and return the set value.
2. "Print" Key: The "Print" key can print the current value if a dedicated serial interface printer is installed in Fluorescence Value Mode and Concentration Mode. In other modes, the "Print" key confirms the changed parameters.
3. "Adj 0" Key: In Fluorescence Value Mode, the key can adjust the current value to zero. In Wavelength Mode, Concentration Input Mode and Factors Input Mode, the key can select every single number from left to right. While selected, the value can be changed. In PMT Level Adjust, The key can reduce PMT level.
4. "Normalize" Key: In Fluorescence Value Mode, The key will normalize the current value to 100 and displays the "%" symbol. Pressing again will cancel the normalization. In Wavelength Mode, Concentration Input Mode and Factors Input Mode, the key will add the selected number from 0-9 in circulation. In PMT Level Adjust, The key can add PMT level.
3.2 Normally Working Condition of Startup
3.2.1 Startup of the Instrument
First turn on the power source of the xenon lamp, and then turn on the power source of the BSFL-103 Fluorospectrophotometer main unit. The xenon lamp needs to stabilize for some time when it is lit. For precise measurement, the time should be 30 minutes over.
Note :
1. If the xenon lamp fails to be lit and a squeaking sound of high frequency or a cracking sound of sparking is continuously produced, please turn off the power source of the xenon lamp immediately. Several seconds later, then turn on the xenon lamp again.(Such a case occurs only when the power source is not stable and capacity of the power source is not sufficient, or xenon lamp closes to the limit of service life).
2. Because the life of the xenon lamp is closely related to the number of on-off of the lamp power source, the unnecessary number of turning on/off the xenon lamp should be cut down as far as possible and the xenon lamp should avoid being turned on/off repeatedly under a high voltage.
3.2.2 Confirmation of Heat Dissipation Fan Running
Every time after startup of the instrument, please first make sure that the heat dissipation fan at the side of the instrument runs normally in order to ensure that the instrument works normally. If finding anything wrong with the heat dissipation fan, should close down the instrument for an overhaul.
3.2.3 Initialization
The instrument will automatically initialize after startup. If the instrument is not connected to the computer, the initialization status will be displayed on LCD. If connected to the computer, the status will be displayed in the software window, and the LCD will show "On-line".
Initialization includes self-checking and self-correcting. Information about every step is given in the table.
STEP | PASS | FAILURE | |
Self- checking | Online self-checking | Into on-line mode | Into single mode |
Database Module | Database initialized | Parameters error Memory chip error | |
DAC Module | DAC Module initialized | DAC module chip error | |
PMT Module | PMT Module initialized | Photomultiplier tube error PMT Module error | |
Motor Module | Motor Module initialized | Motor error Motor driver board error | |
Self- correcting | Wavelength correcting | The value from bottom to top and to bottom again, shows a wave peak. | No obvious wave peak. Wavelength error Check if the sample cell is empty |
Table 2 (Fluorospectrophotometer Initialization List)
3.3 Measurement
After preheating for 30 minutes, the instrument can be used for measurement operation. The operating methods of the two measuring modes (measuring with a single instrument, measuring with an on-line computer) of the instrument are separately different.
When the BSFL-103 Fluorospectrophotometer main unit is connected with a computer, the selection of the different measuring modes and the operating methods are seen in detail.
This section is about the operation of quantitative analysis using a single instrument for measurement.
3.3.1 Pouring the Sample Solution into Sample Cell
Pour the sample solution to be measured into the sample cell up to about two thirds of height. Use filter paper to remove the solution left on the outside surface of the sample cell. Place it carefully into the sample cell holder.
Note: The sample cell is made of quartz material. When using, you should take care to protect the window from light transmission. When taking the sample cell out or placing it into the holder with your hand, hold the sample cell diagonally with your fingers.
3.3.2 Quantitative Analysis in Measurement Mode with a Single Instrument
Measuring mode with a single instrument is mainly used in the working mode for quantitative analysis. There are two methods, that is multipoint method of standard sample and single-point method of standard sample. The two operating methods are as follows.
1. Measuring procedures by Multipoint Method of Standard Sample
Prepare a series of standard solutions (including blank solution). After finishing the preparation of the solution of the unknown sample, operate as the following sequence.
(1) Wavelength Adjustment. Press the "Mode" key to enter Wavelength Mode. "Current Wavelength: ***nm" shows the current wavelength of the emission monochromator. Use the "Adj 0" key or the "Normalize" key to adjust target value. Press the "Print" key after adjustment. The wavelength will be automatically set to target value.
(2) PMT Level Adjustment. Press the "Mode" key into Fluorescence Value Mode. Put the standard solution of maximal concentration into a sample cell. Then press "Mode" to enter PMT level adjustment. "Current PMT level: **" shows the current PMT level. The higher the level is, the more sensitive it will be. Use the "Adj 0" key or the "Normalize" key to adjust the PMT level. Press the "Print" key after adjustment. The PMT level will be automatically set to target value. Adjust the PMT level to make sure the fluorescence value of the maximal concentration standard solution is set between 200-400.
(3) Zero Adjustment. Place the blank solution in the light path. Press the "Mode" key into Fluorescence Value Mode. Wait till the value is stable. Press "Adj 0" to adjust the fluorescence value to zero(±0.1).
Attention: Zero adjustment is not allowed in the following measurement.
(4) Measurement for Standard Sample. Place a series of standard solutions (from dilute to concentrated) in the light path one by one. After the fluorescence value is stable, record the value. Fit a working curve equation according to "Data Processing with Microsoft Excel 2000 Software" provided by Appendix.
(5) Measurement for an Unknown Sample. Place the solution of the unknown sample in the light path. After the fluorescence value is stable, record the value. Acquire the concentration of the unknown sample from the working curve equation.
2. Measuring Procedures by a Single-point Method of Standard Sample
Prepare one standard solution and one blank solution each. After finishing the preparation of an unknown sample solution, operate as the following sequence.
Note: The concentration of the standard sample should be close to that of the sample to be measured as far as possible.
(1) Wavelength Adjustment. Press the "Mode" key to enter Wavelength Mode. "Current Wavelength: ***nm" shows the current wavelength of the emission monochromator. Use the "Adj 0" key or the "Normalize" key to adjust target value. Press the "Print" key after adjustment. The wavelength will be automatically set to target value.
(2) PMT Level Adjustment. Press the "Mode" key into Fluorescence Value Mode. Put the standard solution of maximal concentration into a sample cell. Then press "Mode" to enter PMT level adjustment. "Current PMT Level: **" shows the current level. The higher the level is, the more sensitive it will be. Use the "Adj 0" key or the "Normalize" key to adjust the PMT level. Press the "Print" key after adjustment. The PMT level will be automatically set to target value. Adjust the PMT level to make sure the fluorescence value of the maximal concentration standard solution is set between 200-400.
(3) Zero Adjustment. Place the blank solution in the light path. Press the "Mode" key into Fluorescence Value Mode. Wait till the value is stable. Press "Adj 0" to adjust the fluorescence value to zero(±0.1).
Attention: Zero adjustment is not allowed in the following measurement.
(4) Direct-reading of Concentration. Press the "Mode" key to enter Concentration Input Mode. When the LCD shows "Input Concentration: ", use the "Adj 0" key or the "Normalize" key to adjust the value to be the concentration of the standard solution. Then press the "Print" key to calculate the concentration factor and switch to Concentration Mode.
(5) Measurement for an Unknown Sample. Place the unknown sample in the sample cell. The value on the display window is the concentration of the unknown sample in Concentration Mode. Press the "Print" key to print the current data if connected to a dedicated serial interface printer.
(6) Readout of Concentration Factor. Press the "Mode" key to switch Factor Input Mode. When the LCD shows "Input Factor: ", the value is the current concentration factor. Use the "Adj 0" key or the "Normalize" key to adjust the value of the concentration factor.
Note: When measuring the same sample, by setting the concentration factor, you may measure the sample directly. In this case, the PMT level should be in accordance with that of readout of concentration factor.%1%
3.3.3 Shutdown Instrument
Turn off the power source of the BSFL-103 Fluorospectrophotometer main unit first, and then the power source of the xenon lamp. (The order is reversed to that of a startup.)
If in on-line mode, close the software first, then turn off the power source of the main unit, and turn off the Xenon lamp.
Note: After turning off the power source of the xenon lamp, please wait for 60 seconds at least. Then turn on the xenon lamp if you want to use it once again.
4. Installation of the Instrument
4.1 Installation Environment
The instrument is suitably used in a laboratory room to perform analytical measurements. Since it works in combination with a computer, the working conditions must meet the following demands.
4.1.1 Space Environment of Laboratory
Environment temperature range:10-30°C. Environment humidity is less than 85℅.Corrosive gas and other organic or inorganic solvent gas that is absorptive within the range of violet radiation should not be contained in the atmosphere.
4.1.2 Working Table
The instrument should be placed on a sturdy and level table or the like, avoiding strong vibration, direct sunlight, and dust.
4.1.3 Power Source
Alternating voltage must be within a range of 220V±22V, 110V±11V.
4.1.4 Environmental Alternation
If the instrument needs to be used at a worksite, the working environment should accord with the above demands for the environment. If moving the instrument to other places, please use original packing materials. If users have any special demands, may place a special order for the instrument.
4.2 Unpacking for Checking
The BSFL-103 Fluorospectrophotometer main unit and the computer or the main unit and the printer are packed with a fiberboard box. For long-distance transport, users may make a request for a wooden box as additional outer packing.
4.2.1 Checking the Outer Packing
Before unpacking, check that the outer packing is intact. If finding the packing to be incomplete or finding marks of impact on the packing, please contact the transport insurance department.
4.2.2 Unpacking for Counting
Unpack at the position of adhesive seal tape. Take out the BSFL-103 Fluorospectrophotometer main unit carefully. (Please keep the outer packing so as to use it again when moving the instrument later. Check the main unit, the standard fittings, accessories purchased by choice and spare parts against the packing list. If anything is missing or damaged, please contact the local dealer or our company immediately.
Standard fittings | BSFL-103 Fluorospectrophotometer main unit | One piece |
365nm filter (installed in the main unit) | One piece | |
Software package of data processing for BSFL-103 Fluorospectrophotometer (set) | One set | |
Power line | One piece | |
USB wire | One piece | |
Quartz sample cell 10mm | One pair | |
Fuse (2A/5A) | two pieces | |
Instruction Manual for BSFL-103 Fluorospectrophotometer | One copy | |
Certification of products | One copy | |
Packing list | One copy | |
Spare parts Purchased by choice | 200―850nm Interference filter (φ25nm) | |
Quartz sample cell 10mm | ||
Glass sample cell 10mm | ||
Fuse (2A/5A) | ||
USB wire | ||
Power line | ||
Accessories Purchased by choice | Microcomputer main unit Display device | |
Dedicated serial interface printer | ||
Membrane kind sample accessories | ||
Powder kind sample accessories | ||
Microscale capillary sample accessories | ||
Jacket sample pool accessories | ||
200μL centrifuge tube accessories | ||
Semi-auto sample introduction accessories(LG2.002.001) |
Table 3 (Fluorospectrophotometer fitting list)
Note: Accessories and spare parts purchased by choice are provided according to order contract.
4.3 Installation
4.3.1 Cleaning
Remove all adhesive tapes used for fixing during transport. Clean the surface of the instrument.
4.3.2 Check of Power Source Matching
Check that the power voltage to be supplied to the instrument should accord with that of the local.
4.3.3 Connecting the Power Cord
Place the BSFL-103 Fluorospectrophotometer main unit and the computer or the printer on a sturdy working table, and they should be 10cm over away from the wall. Connect the power cord accompanied with the instrument to the electric supply socket of the laboratory room.
4.4 Adjustment of Instrument
4.4.1 Signal Noise Ratio Test (Using Raman Spectral Peak of Water)
1.Testing Mode Using a Single Instrument
Make sure the sample cell is empty. First turn on the power switch of the xenon lamp. Check that the xenon lamp is lit. Then turn on the power switch of the instrument. After starting up, the instrument will automatically initialize. (The instrument possesses a self-checking function through a computer and a function of self-correcting wavelength).This process takes about several minutes.
(1) Preheating
After the instrument is started up, the xenon lamp and other electronic components need time to attain a thermal equilibrium. So measuring operation should be carried out after 30 minutes of starting up for preheating.
(2) Putting in Sample
Put the sample (redistilled water) into a clean quartz sample cell. Hold the sample cell diagonally with fingers, and place it into the sample cell holder.
Attention: If the quartz sample cell is not clean, it will affect the precision and reduce the S/N.
(3) Wavelength Adjustment
Adjust the value of current wavelength to 415 nm.
(4) PMT Level Adjustment
The purpose of PMT level adjustment is to let the displayed value of the sample to be measured be proper. Adjust the value of fluorescent intensity between 100 and 200. Find the wavelength value (λmax) of the maximum fluorescent intensity at about 415nm. For more information on adjustment.
Then observe for 2 minutes at the wavelength λmax. Record the values of maximum and minimum fluorescent intensity, respectively. The sum of the two values is divided by two to give an average value of fluorescent intensity at wavelengthλmax. The difference between the two values is the value of noise at wavelengthλmax.
After that, adjust the wavelength to 315nm. The displayed value of fluorescent intensity is the background value of Raman spectral peak of water. The difference between the above average value of fluorescent intensity atλmax and the background value at 315nm is divided by the value of noise to give signal noise ratio (S/N) of the instrument.(The product index of the instrument S/N≥150).
Note:
1. In order to protect the photomultiplier, when PMT level is higher (6), please do not let high light pass into the sample compartment.
2. When adjusting PMT level, readjustment of the automatic PMT level system of the instrument will influence the original set for zero-point of fluorescence. After adjusting the PMT level, please check the zero-point. If zero-point changes, it may be adjusted once again.
(5) Shutdown of Instrument
After finishing the test, shut down the instrument. Please turn off the power source of the xenon lamp first. And then turn off the power source of the BSFL-103 Fluorospectrophotometer main unit.
2. Testing Mode by using the Instrument in Combination with an On-line Computer
Finish the measurement for Raman Spectral Peak of water by using wavelength scan and time scan in the computer software. The use of software please turn to Part Two.
4.4.2 Checking Wavelength of the Instrument
The instrument can automatically check the accuracy of indicated value of the instrument wavelength. If finding a mistake, may use a mercury-arc lamp to check (If there is no mercury-arc lamp, a fluorescent lamp can be used instead, but a professional man must be needed to do such work. The concrete method and the correcting procedures will be briefed through training.).
The wavelengths of spectral lines of a mercury-arc lamp are listed in the Table.
No. | wavelength /nm | No. | wavelength /nm |
1 | 253.65 | 7 | 404.66 |
2 | 296.73 | 8 | 407.78 |
3 | 302.15 | 9 | 435.84 |
4 | 313.16 | 10 | 546.07 |
5 | 334.15 | 11 | 576.96 |
6 | 365.01 | 12 | 579.07 |
Table 4
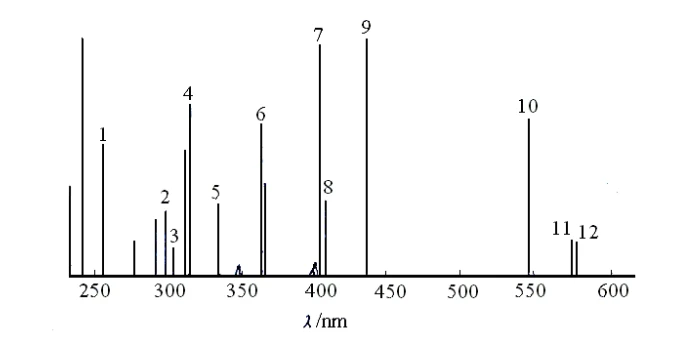
Figure 11 (spectrogram of mercury-arc lamp)
5. Maintenance of the Instrument
5.1 Routine Maintenance
1. In routine operation, always check and make sure that the working conditions accord with the demands. If finding that the working conditions do not accord with the demands, should take measures without delay.
2. While the main unit of the instrument is working, keep good ventilation over the surface of the heat dissipation opening at the top of the instrument. It is unsuitable to stack other articles nearby.
Note: The temperature at the heat dissipation opening is very high. Be sure not to touch for fear of being burnt.
3. Keep the instrument clean. When the main unit of the instrument is not used, put a dust-proof cover over it. When cleaning the outside surface of the instrument, may wipe it with warm water. Do not use organic solvents such as alcohol, ether, and acetone. Please do not clean while the instrument is still working.
4.The sample cell should be kept clean.
5.2 Maintenance and Replacement of Light Source Lamp
5.2.1 Maintenance of Light Source Lamp
1.A high-performance xenon lamp is used as the light source lamp of the instrument. It is mounted in a special lamp chamber. The surface of the xenon lamp must be kept clean.
2. When turning on/off the xenon lamp, it should strictly follow the operating sequence.
Note: When starting up the instrument, please turn on the power source of the xenon lamp first. After the xenon lamp is lit, then turn on the power source of the main unit of the instrument. When shutting down the instrument, please turn off the power source of the main unit of the instrument first, and then turn off the power source of the xenon lamp.
3. When the voltage of the power source is not stable and the capacity of the power source is not sufficient, or the xenon lamp closes to the limit of service life, lighting a xenon lamp is often difficult.
Note: If the xenon lamp fails to be lit and a squeaking sound of high frequency or a cracking sound of sparking is continuously produced, please turn off the power source of the xenon lamp immediately. Several seconds later, then turn on the xenon lamp again.
4. The xenon lamp should avoid being turned on/off repeatedly under a high voltage.
Note: Because the life of the xenon lamp is closely related to the number of on-off of the lamp power source, the unnecessary number of turning on/off the xenon lamp should be cut down as far as possible.
5. After starting up the instrument, make sure that the heat dissipation fan of the instrument runs normally, and be sure to keep the surface of heat dissipation opening at the top of the instrument well ventilated.
5.2.2 Replacement of Light Source Lamp
A precise combination light source that has been corrected in advance in the factory is used in the instrument. A professional man must be needed to replace a damaged light source lamp. The concrete method and the correcting procedures will be briefed through training.
5.3 Maintenance and Replacement of Filter
5.3.1 Maintenance of Filter
1. The surface of the filter should be kept clean.
Note: If having touched the surface of the filter, please wipe it clean with a piece of lens tissue and alcohol then dry it.
2. The filter stripped down must be cleaned then be wrapped up with lens tissue. After that it should be put into a container holding desiccant and be well preserved.
5.3.2 Replacement of Filter
1. Remove the cover of the sample compartment. Unscrew the knurled screw which is on the right side of the excitation part.
2. Open the cover board on the excitation part from the top left of the knurled screw.
3. Take out the excitation part.
4. Remove the front pressing ring of the excitation part anticlockwise.
5. After that, hold the both sides of the filter edges with fingers and take it out. Then place a new one into the pressing ring. (There are no obverse and reverse sides for a filter.). Screw the pressing ring into the filter position in the front of the sample compartment clockwise and screw it tightly.
Note: When taking the filter out, please not touch the filter surface of light-transmission.
6. Make sure the cover board is open. Then put the excitation part on the frame.
7. Close the cover board. Tight the screws.
6. Environmental Requirements of Using Software and Installation
Before reading this part, please first read the "Operation Instruction for the Instrument" in Part Two and the operation manuals for the above versions of Windows 98.
6.1 Basic Configuration of Computer Hardware and Software
6.1.1 Hardware
CPU P2 Celeron is 600 or more. Computer memory is not less than 64 M. Computer hard disc should have enough space to run (about 200M). Two serial ports of the computer should run normally, and no interruption conflict occurs in the system.
Image resolution is more than 800x600 and color enhancement is more than 16-bit.
6.1.2 Software Requirements
The second edition of Windows 98 is used (The above versions of Windows98 can also be used.) in this part. While the computer is running, it is necessary to turn off the screen saver and to turn off power management in the BIOS program to ensure that the "Data processing software package of BSFL-103 Fluorospectrophotometer" can run normally.
6.2 Installation of "BSFL-103 Software"
Place the CD-ROM into the drive. The computer will automatically install an application. In the absence of automatic installation, open the X: \ (double-click) SETUP.EXE documents (applications). When the SETUP window appears, click the "NEXT" button and type in the name and company name. Click the "NEXT" button again and the Installation Path dialog box appears.
If there is no need for change, please click the "NEXT" button directly. If you are hoping to amend the path, click the "Browse" button. Afterwards the Item Name dialog box will appear. The default name is "The Software Package of BSFL-103 Fluorospectrophotometer". You may click the "NEXT" button directly or change the item name, then confirm the dialog boxes of all above steps.
If hoping to amend, click the " Back" button, or click "NEXT" button directly. The computer begins to read CD-ROM for installation. After the installation has been completed, restart the computer to run the program.
Note: The used CD-ROM has its own serial number, and it must be connected with the instrument of the same serial number. It cannot be used with other instruments of different serial numbers in a crossing way. The software will not operate normally in such cross-use.
7. Operation of Software
7.1 Operation of Software
7.1.1 Connection of BSFL-103 Main Unit with a Computer
The BSFL-103 main unit is connected through a USB port of a computer. The USB driver will be installed when the first time connected. Please run the software after the installation is finished.
7.1.2 Procedure for On-line Operation (Startup)
1.USB wire connection
Connect BSFL-103 main unit to a computer with USB wire.
2.Turn on BSFL-103
First turn on the Xenon Lamp. Then turn on the power source of the main unit of the instrument after the Xenon Lamp is lit. The instrument will automatically check the connection, and enter on-line condition.
3. Initialization
Run "BSFL-103 Software". The software will check the connection and start initialization.On completion of initialization, the interface of wavelength scan mode is directly displayed.
Note: In the execution of initialization, please not place any sample into the sample compartment.
4.Relevant Working Modes
Click "Working Mode" on the menu bar in to switch between the three modes: "Wavelength Scan", "Time Scan", and "Quantitative Analysis".
5.On-line Mode Power Off
In on-line mode, close the software first, then turn off the power of the main unit.
If the main unit is turned off first, that leads to a communication error in the software.
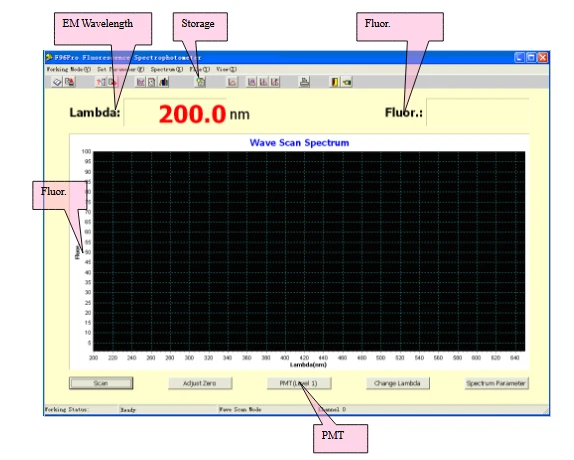
Figure 12 (Interface of Wavelength Scan)
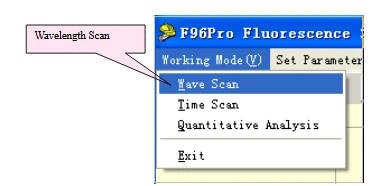
Figure 13 (Switchover of Working Mode)
7.2 Three Interfaces of Working Mode
There are Three Interfaces of Working Mode, namely the interface of wavelength scan, the interface of time scan and the interface of quantitative analysis.
7.2.1 The Interface of Wavelength Scan
Wavelength scan means that in the conditions of selected excitation source (namely at excitation wavelength) people measure the fluorescent intensity which varies with fluorescent emission wavelength, that is, plot the fluorescence spectrum of a sample component.
Wavelength scan can be used as a selection of fluorescent emission wavelength measured in researches on the method of quantitative analysis for fluorescence and can also be used to study the emitting behavior of fluorescent molecules in solutions.
The interface of wavelength scan mode is displayed.
7.2.2 The Interface of Time Scan
Time scan means that in the conditions of selected excitation source (namely at excitation wavelength) people observe how the fluorescent intensity of a sample component varies with time at a wavelength of fluorescent emission.
Time scan can be used as a method of kinetic analysis for measuring fluorescence, be used to develop research on experimental conditions of quantitative analysis for measuring fluorescence and can also be used to measure drift and noise of the instrument.
The interface of time scan is displayed.
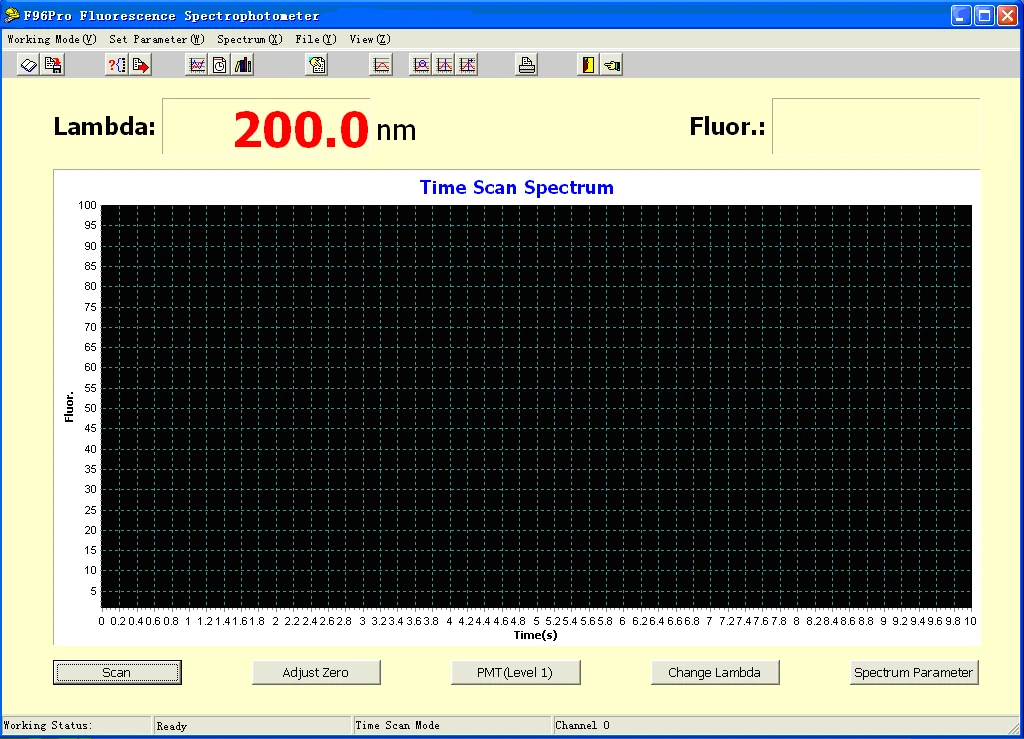
Figure 14 (Interface of Time Scan)
Time scan differs from wavelength scan in that the unit of abscissa is time during scanning. In the functions such as "Set Parameter", "Spectrum", "File" and operation, the requirements for time scan are the same as those for wavelength scan.
7.2.3 The Interface of Quantitative Analysis
Quantitative analysis means that in the conditions of selected excitation source (namely at excitation wavelength) by measuring the fluorescent emission intensity (F) of the component (its unknown concentration C) to be determined, from the formula F=KC, the concentration of the component to be determined is acquired. K in the formula is a constant related to the test conditions and it can be acquired by measuring the fluorescent emission intensity of a standard solution of the component to be determined and then by calculating in the same test conditions. With the fluorescent emission intensity of many standard solutions it can also be acquired by linear fitting or graphical solution methods. Quantitative analysis can be used to measure the content of the component of emitting fluorescence in the sample solution.
The interface of quantitative analysis is displayed.
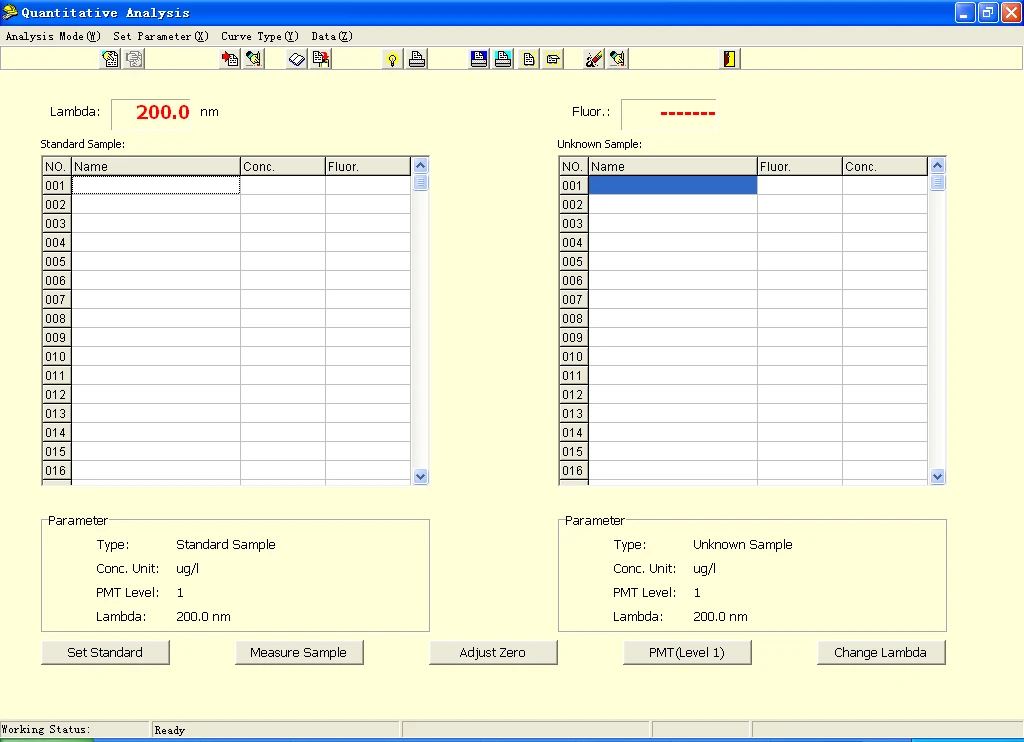
Figure 16 (Interface of Quantitative Analysis)
8. Operation of Wavelength Scan Mode (Connected with a Computer)
8.1 The Interface of Wavelength Scan Mode
On completion of initialization for the instrument, the interface of wavelength is immediately displayed. The first row at the top of the screen is Menu Bar. In the second row are 15 "Shortcut Icons". On the screen are wavelengths, display windows of fluorescence, and coordinate graphs with fluorescence value and wavelength. At the bottom of the screen there are 5 "Shortcuts".
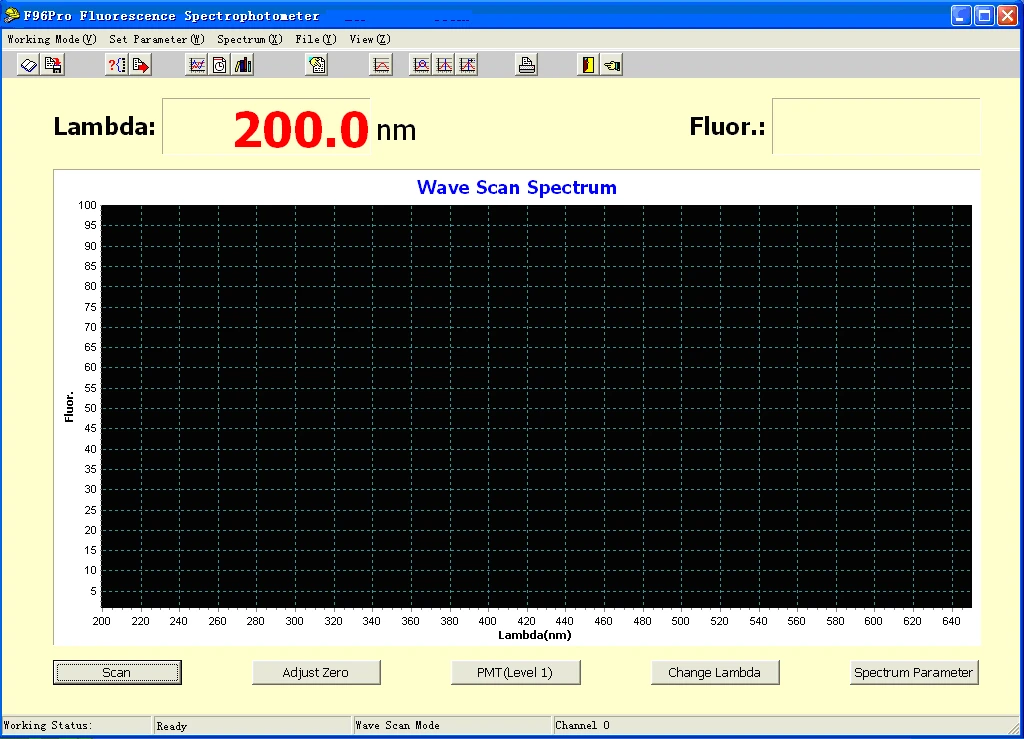
Figure 17 (Shortcuts in the Interface of Wavelength Scan of Fluorescence Spectrum)
8.1.1 The Functions of Shortcuts at the Bottom of the Screen
"Scan" is the button for starting. After you click it, scanning a spectrum according to the parameters set.
"Adjust Zero" is the button for zero adjustment of the current value. It is used to deduct a background value.
"PMT(Level 1)" is the button for PMT level adjustment. Select a proper PMT level(1-17) in the pop-out window. Then click OK.
"Change Lambda" is the button for adjusting the current wavelength. The instrument main unit will automatically change the current wavelength to the wavelength set.
"Spectrum Parameter" is the button to show the parameters of the current wavelength scan.
8.1.2 The Functions of Shortcut Icons
When the mouse pointer is moved onto a shortcut icon, the function of the shortcut icon will show. Icons are arranged in order from left to right. The functions are described below.
 "Load Spectrum" button means to open a previously saved spectrum.
 "Save Spectrum" button means to save the current spectrum.
 "Transmit Spectrum" button means to transmit a spectrum between the channels.
 "Transmit Parameter" button means to transmit the spectrum parameters in the current channel to other channels.
 "Wave Scan" button means to switch the current working mode to wavelength scanning mode.
 "Time Scan" button means to switch the current working mode to time scanning mode.
 "Quantitative Analysis" button means to switch the current working mode to quantitative analysis mode.
 "Parameter" button means to set scan parameters.
 "Restore Parameter" button means to restore the spectrum of the current channel to its original status.
 "Smooth" button means to carry out an operation of average value for the spectrum data, so that the spectrum becomes smoother.
 "P/V Detection" button means to detect the values of the valley & peak of a spectrum.
 "Show P/V Data" button means to display the values of peak & valley in a spectrum after peak & valley detection.
 "Print" button means to print out a spectrum and data.
 "Exit System" button means to close BSFL-103 Software.
"Locate Lambda to print" button means to select a wavelength you need for printing out.
8.1.3 Menu Bar at the Top of the Screen
"Working Mode": After clicking it with the mouse left button, from the pull-down menu select change of working mode or exit from the program.
The other items on the menu bar are "Set Parameter", "Spectrum", "File" and "View". The operations and the setting methods.
8.2 Wavelength Scanning Operation
Fluorescence spectrum can be acquired by wavelength scan, and the wavelength of fluorescent measurement used for quantitative analysis can be determined from the fluorescence spectrum.
8.2.1 Parameter Setting
On completion of initialization of the instrument, the interface of wavelength scan appears immediately. Before scanning operation, you need to set scanning parameters first.
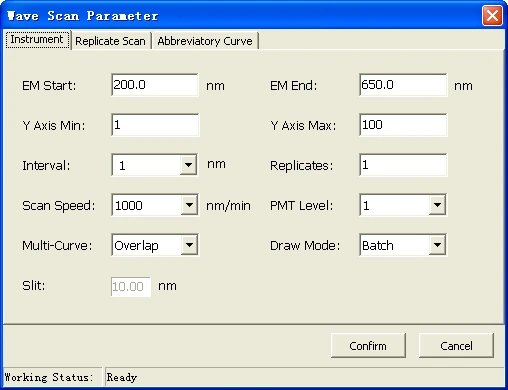
Figure 18 (Interface of Wavelength Scan Parameter)
1. EM Start. Set the start wavelength of the scan.
2. EM End. Set the end wavelength of the scan.
3. Y Axis Min. Set the minimum of the Y axis in the scan spectrum.
4. Y Axis Max. Set the maximum of the Y axis in the scan spectrum.
5. Interval. Set the data interval of wavelength scan.
6. Replicates. Set the number of scans.
7. Scan Speed. Set the scan speed. The value automatically changes with wavelength intervals.
8.PMT Level. Set the PMT level of time scan.
9.Multi-Curve. Set the display mode of curves. "Overlap" shows different curves in the same window. "Overlay" will cover the last time scan curve, only showing the latest.
10. Draw Mode. Set the plot mode of wavelength scan. "Real Time" will show the current data of wavelength scan. "Batch" will show all data after the wavelength scan.
11. Slit.Its value is unchangeable and it has a bandwidth of 10nm.
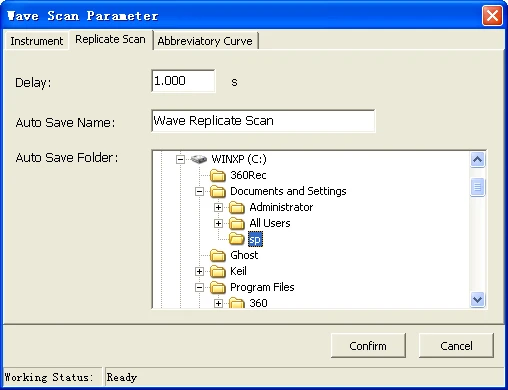
Figure 19 (Interface of Wavelength Scan Parameter - Replicate Scan Settings)
12.Delay. Set the Delay between two scans.
13.Autosave Filename. Edit the filename of spectrum. The software will automatically add the current time of scan after the filename.
14.Autosave Position. Set the autosave position in your computer.
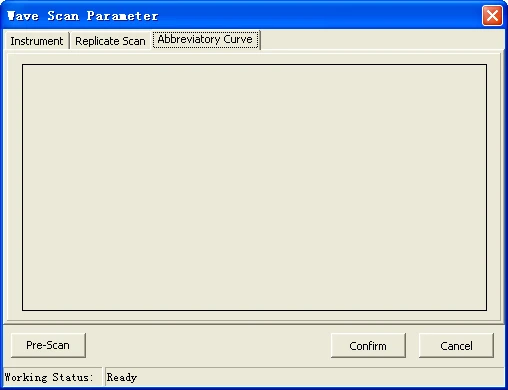
Figure 20 (Interface of Wavelength Scan Parameter - Abbreviatory Curve)
15. Pre-Scan. It's a fast scan according to "Basic Settings" in "Wavelength Scan Parameter". After a Pre-Scan, a thumbnail is created and the proper Y axis will be automatically set.
8.2.2 Spectrum Processing
Clicking the "Spectrum" button from Menu Bar presents a pull-down sub-menu.
1.Zoom. This means to reduce or enlarge a spectrum. After clicking this item you only need to input the scale data of a new spectrum.
For enlargement you may directly use the mouse to drag the spectrum on the screen. The method is to drag in the direction from the top left side of the spectrum to the bottom right side of the spectrum. If you want to return the enlarged spectrum to the original one, you may drag in the opposite direction.
2.Differential Coefficient. This means to differentiate with respect to the spectrum. The 1st-4th order of derivative operation on the spectrum is performed. The set value of the derivation interval must be twice the value of the scan interval.
3.Restore. The spectrum may be restored to the original one.
4.Smooth. This means to perform calculations on the average value for each point of the spectrum to make the spectrum smoother.
5. P/ V Detection. It is used to detect the values of peaks and valleys of a spectrum.
(1) Click this item and "Input Sensitivity" dialog box will appear. Input a limited value of "Input Sensitivity" as a value of available peaks. All peaks above the limited value can be detected. For example, if the value of "Input Sensitivity" is 25, peak value 50 can be detected. If the value of "Input Sensitivity" is 60, peak value 50 cannot be detected.
(2) Then click "Show P/V Data" on the sub-menu, and the values of peaks & valleys will be displayed.
6. Arithmetic. Click "Arithmetic", the interface of "Arithmetic" will open. This calculation can be used as the operation between a single channel and constants, and can also be used as the arithmetic operation between channels.
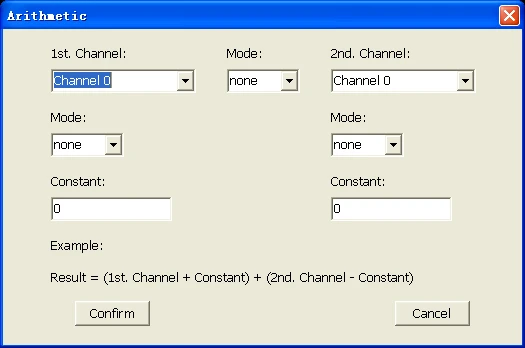
Figure 21 (Interface of Arithmetic Operation)
7.Sigma. After clicking this item, input "Lambda Start" and "Lambda End", and then click the "Sigma" button. You will get the integral value of fluorescence within the range of set wavelength.
8. Show P/V Data. Shows the values of peaks & valleys.
9.Export Data. The output of the spectrum is in the form of data. There are two ways of data-out: discrete and continuous.
(1) Output of Discrete Data: Using the key ctrl or the key shift in combination with the mouse, from the list box select the wavelength values whose datum are required to examine.
(2) Output of Continuous Data: Input the range of wavelengths whose datum are required to examine. Their values can be printed out.
9.Print. After it is clicked, "Input Spectrum Name" dialog box appears. Type in the spectrum name. Then click "OK".
Note: Before printing, please first confirm the condition of the printer installation.
8.2.3 Save Processing
Click "File" and a pull-down sub-menu.
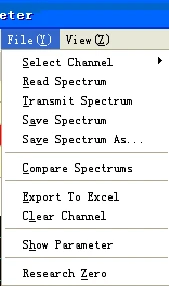
Figure 22 (Save Processing Sub-menu)
1. Select Channel. 10 channels (storage windows) altogether are provided for selection. The program can separately open 10 storage windows of wavelength scan or time scan at most for users' use.
Note: 10 channels cannot run at the same time. Only the current channel can run. Quantitative Analysis, time scan and wavelength scan share the 10 channels.
2. Read Spectrum. Show spectrum in the current channel. When the mouse pointer is moved onto the wavelength scan window and the right button is pressed down, the number of channels will be seen.
3. Transmit Spectrum. Copy the spectrum of one channel into another channel.
4. Save Spectrum. Save the selected spectrum and the file name onto the hard disc.
5. Save Spectrum As. Save the spectrum onto the hard disc. After a dialog box appears, you can input another file name and click "Save".
6. Compare Spectrums. This function compares different spectrums. For example, when comparing cha